Managerial Accounting Assignment Analyzing Financial & Non-Financial Information Of Business Scenarios
Question
Task:
The questions to be answered in this managerial accounting assignment are:
Week 1
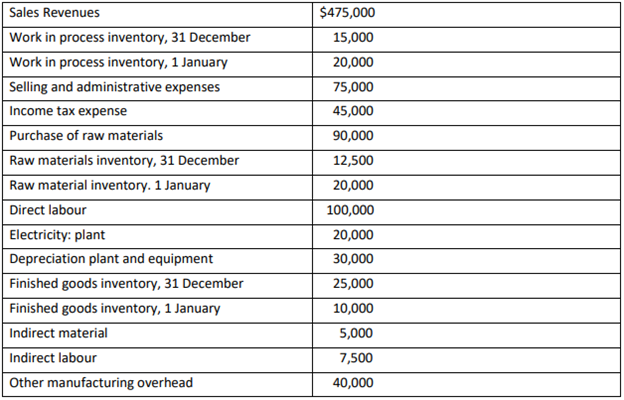
The following data refer to Nani’s Fashions for the current year:

Required:
- Prepare the schedule of cost of goods manufactured for Nani’s fashion.
- Prepare the schedule of cost of goods sold for Nani’s Fashions and explain the information provided by the schedule of cost of goods sold.
- Prepare an income statement for the current year.
Week 2
Brisbane Indoor Sports, a sporting complex, has opening hours that fluctuate from month to month. The electricity costs and hours of operation for past six months is listed below:

Required:
- Use the high-low method to estimate the cost behaviour for the complex’s electricity costs, assuming that the variable costs vary in proportion to the hours of operation. Express the total cost behaviour in formula form (Y = a + bx). What is the variable electricity cost per hour of operation?
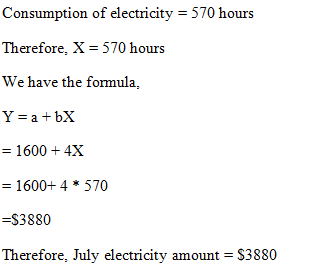
- During July, the complex will open for 570 hours. Predict the complex’s total electricity costs for July using the cost estimation method employed in above requirement a).
- What is the main drawback of the high-low method of cost estimation?
Week 3
Toys World started and finished job number A26, a batch of 1,000 cuddly koalas, during March 2020. The job required $4,850 of direct material and 32 hours of direct labour at $20 per hour. The predetermined overhead rate is $10.50 per direct labour hour. On 31st March, 900 of the cuddly koalas were shipped to a local toy shop.
Required:
- Prepare journal entries to record the incurrence of production costs, completion of job number A26 and the shipment of 900 cuddly koalas to local toy shop.
- Calculate the cost per cuddly koala for job number A26.
- How might the managers at Toys World use this information?
Week 4
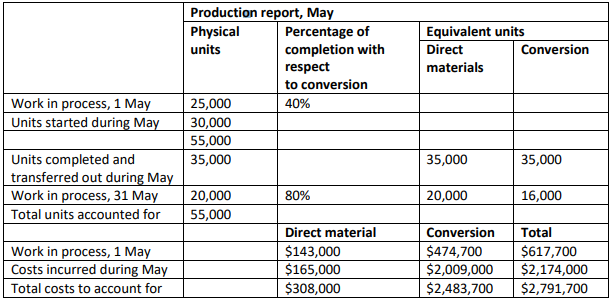
Rigby Ltd accumulates costs for its single product using process costing. Direct material is added at the beginning of the production process, and conversion activity occurs uniformly throughout the process. The following is a partially completed production report for May.

Required:
- Complete the following process costing steps using the weighted average method:
- Calculation of equivalent units.
- Calculation of unit costs.
- Analysis of total costs.
- Analysis of total costs.
Week 5
Mel Snow is the manager of a firm, Taxation Matters, which specializes in the preparation of income tax returns. The firm offers two basic products: the preparation of income tax returns for wage and salary earners, and the preparation of income tax returns for small businesses. Any clients requiring more complex services are referred to Snow’s brother Roger, who is a partner in a large firm of chartered accountants.
The processing of wage and salary tax returns is quite straightforward, and the firm uses a software package to process data and print the return. A software package is also used to prepare returns for small businesses, although more information is required, particularly about business expenses.
Snow has only recently joined Taxation Matters and he is concerned about the firm’s pricing policy, which sets flat fees of $60 per return for wage and salary clients and $300 for small businesses. He decides to use activity-based costing to estimate the costs of providing each of these services.
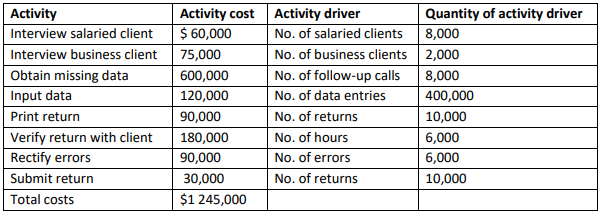
At the end of the year, Snow reviewed the firm’s total costs and activities, resulting in the following list:

In identifying the activities required for each type of return, Snow noted the following:
Clients are interviewed only once per return.
- All follow-up calls to obtain missing data relate to business returns; on average, each business tax return requires four follow-up calls.
- Processing a wage and salary tax return requires 20 data entries, whereas a business return requires 120 data entries.
- On average, it takes 22.5 minutes to verify a wage and salary tax return, whereas it takes one and a half hours to verify a business return.
- All errors relate to business returns; on average, there are 3 errors per business return.
Required:
- Use activity-based costing to estimate the cost of preparing:
- A wage and salary tax return.
- A business tax return.
- In the light of your answers to requirement 1, evaluate the firm’s pricing policy.
Answer
WEEK 1
Managerial Accounting Assignment Part a. Cost of Goods sold
|
|
|
|
|
Cost Sheet Nani's Fashion |
||
|
|
|
|
|
Details |
Amt ($) |
Amt ($) |
|
|
|
|
|
Raw materials |
|
|
|
Opening stock raw materials |
20000 |
|
|
Add: Purchase RM |
90000 |
|
|
Less: Closing Stock RM |
12500 |
|
|
Total raw material consumed |
|
97500 |
|
Direct Labour |
|
100000 |
|
|
|
|
|
PRIME COST (raw material + Labor) |
|
197500 |
|
|
|
|
|
Indirect Cost |
|
|
|
Works or Factory Overhead |
|
|
|
Indirect Material |
5000 |
|
|
Indirect Labour |
7500 |
|
|
Electricity Plant |
20000 |
|
|
Depreciation Plant and Equipment |
30000 |
|
|
Other Manufacturing Overhead |
40000 |
|
|
Factory cost = (Prime cost + Indirect cost) |
|
102500 |
|
Add: WIP opening |
|
20000 |
|
Less: WIP closing |
|
15000 |
|
|
|
|
|
WORKS COST/ COST OF MANUFACTURING |
|
305000 |
|
|
|
|
|
Add: Finished Goods opening |
|
10000 |
|
Less: Finished Goods closing |
|
25000 |
|
|
|
|
|
Cost of Goods sold = |
|
290000 |
|
Selling and Administrative Expenses |
|
75000 |
|
COST OF SALES |
|
365000 |
|
PROFIT (SALES - cost of Sales) |
|
110000 |
|
SALES |
|
475000 |
Part b.
Schedule cost of goods sold = $29000
An organization needs to learn about the overall efficiency of its day to day business operations by understanding the division of costs and knowing the cost of goods sold. Various methods can help users in evaluating the efficiency of a business organization. Users can choose any method that suits their needs and preferences. Evaluating the gross profits earned during a particular period is one of the best methods for calculating the efficiency of a business organization. Gross profit can be calculated by reducing COGS (cost of goods sold) from the revenue that is earned as a result of sales. COGS can be defined as the costs that are borne by an organization for acquiring or manufacturing the goods that it sells. COGS are a powerful indication of operational efficiency. Nani’s Fashion can minimize their cost of goods sold by eliminating unnecessary costs associated with the production of goods. If there is a sudden rise in the cost of goods sold then the management must take necessary measures to figure out the probable reasons attributing to such a rise in the COGS (Charles 2012).
Part c
Income Statement
|
Income Statement of Nani's Fashion |
|||
|
|
|
|
|
|
Opening Stock |
10000 |
Sales |
475000 |
|
RM |
20000 |
|
|
|
WIP |
20000 |
Closing Stock |
|
|
FG |
|
RM |
12500 |
|
|
|
WIP |
15000 |
|
Purchased of Raw Materials |
90000 |
FG |
25000 |
|
Labour |
100000 |
|
|
|
|
|
|
|
|
Gross Profit |
287500 |
|
|
|
|
527500 |
|
527500 |
|
|
|
|
|
|
Indirect Material |
5000 |
Gross Profit |
287500 |
|
Indirect Labour |
7500 |
|
|
|
Electricity |
20000 |
|
|
|
Depreciation |
30000 |
|
|
|
Other Manufacturing Overhead |
40000 |
|
|
|
Selling and Administrative Expenses |
75000 |
|
|
|
Income Tax Exp |
45000 |
|
|
|
|
|
|
|
|
Net Income |
65000 |
|
|
WEEK 2
Data provided
|
Month |
Total Hours of Operation |
Total Electricity Cost |
|
Jan |
650 |
4240 |
|
Feb |
700 |
4400 |
|
March |
800 |
4800 |
|
April |
600 |
4200 |
|
May |
550 |
3700 |
|
June |
500 |
3600 |
From the above we got the following
|
Highest Level |
800 |
4800 |
|
Lowest Level |
500 |
3600 |
Computation of variable cost per unit
Formula is Highest Activity Cost -Lowest Activity Cost/Highest Activity Units - Lowest Activity Units
Applying the data in formula we get,
(4800-3600)/(800-500)
=4
Hence, variable cost per unit is $4
Computation of fixed cost
Formula is Highest Activity Cost - (Variable Cost per Unit * Highest Activity Units)
=4800-(800*4)
=1600
Computation of High – Low cost
Formula is Fixed Cost + (Variable Cost * Unit Activity)
Y = a + bX
= 1600 + 4X
Part a
Variable electricity cost per hour = $4
Part b

Part c
The high low-cost estimation suffers from various disadvantages and hence is not an accurate mechanism. This method considers the high and low value thereby neglecting the other values in the process. The non-consideration of the other values fails to provide a clear implication and hence the judgment does not provide a clear picture (Drury 2011). Furthermore, the process even involves collecting all the data value and then to select the high and low. In this process, the user needs to arrange all the data that can be time-consuming. Moreover, using this method does not provide a correct estimate hence the result is not highly reliable.
WEEK 3
Part a
|
Journal Entries of Toys World |
||||
|
Date |
Particulars |
LF |
Debit ($) |
Credit ($) |
|
|
|
|
|
|
|
1 |
WIP Ac Dr |
|
4850.00 |
|
|
|
To, Raw Materials |
|
|
4850.00 |
|
|
(usage of materials for Job A26) |
|
|
|
|
|
|
|
|
|
|
2 |
WIP Ac Dr |
|
640.00 |
|
|
|
To, Salaries and Wages |
|
|
640.00 |
|
|
(Job A26 labor charges at 20 per hour for 32 hours) |
|
|
|
|
|
|
|
|
|
|
3 |
WIP Ac Dr |
|
336.00 |
|
|
|
To, Factory Overhead |
|
|
336.00 |
|
|
(Factory Overhead share of Job A26 at 10.50 per labour hour for 32 hours) |
|
|
|
|
|
|
|
|
|
|
4 |
Job A26 AC Dr |
|
5826.00 |
|
|
|
WIP AC |
|
|
5826.00 |
|
|
(manufacture of 1000 units in Job A26 and stored) |
|
|
|
|
|
|
|
|
|
|
5 |
Local toy shop |
|
5243.40 |
|
|
|
Job A26 |
|
|
5243.40 |
|
|
(transfer of 900 units @ 5.826 per unit) |
|
|
|
|
|
|
|
|
|
Part B
|
Computation of Cost per unit |
|
|
|
|
Particulars |
Units |
Rate |
Amount ($) |
|
|
|
|
|
|
Direct Material |
|
|
4850 |
|
Direct Labor |
32 |
20 |
640 |
|
Overhead |
32 |
10.5 |
336 |
|
|
|
|
|
|
Total |
|
|
5826 |
Thereby 1000 units costs $5826
Cost of 1 units = 5826/1000 =5.8$
Part c
Managers can use the information to understand the process of product planning. The above information provides a clear interpretation and data of the per-unit cost and hence this can be used by the manager to know the selling price and hence arriving at the profit becomes easier. Cost price per unit provides a major advantage when it comes to understanding the overall product planning. Moreover, this information will help the company to understand the selling price implication, and hence, the company can enter into a better negotiation and bargain with the suppliers. The availability of the unit price further helps in making a meaningful decision that can help the company to understand the pricing policy thereby helping to frame better policies.
Week 4
Part ai)
Total units = 25000 (WIP) + 30000 (units introduced) = 55000
|
particulars |
Production |
||||
|
|
|
material |
Conversion |
||
|
|
|
% |
Units |
% |
Units |
|
Completion |
35000 |
100 |
35000 |
100 |
35000 (35000*100%) |
|
WIP |
20000 |
100 |
20000 |
80 |
16000 (20000*80%) |
|
|
|
|
|
|
|
Part a ii)
|
Computation of Cost for single unit |
|||
|
Particulars |
Material |
Conversion |
Total |
|
1 May WIP (a) |
143000 |
474700 |
617700 |
|
May costs (b) |
165000 |
2009000 |
2174000 |
|
|
|
|
|
|
Total costs = (a+b) |
308000 |
2483700 |
2791700 |
|
Units Equivalent |
55000 |
51000 |
|
|
|
|
|
|
|
Costs per unit = |
5.6 |
48.7 |
54.3 |
Part aiii)
Total cost sums to Total units + Material + Conversion
= 1900500 + 112000 + 779200
= 2791700
Part B
|
Journal entry |
|||
|
Particulars |
L.F. |
Amount |
Amount |
|
F. Goods A/c Dr. |
|
1900500 |
|
|
To Process A/c |
|
|
1900500 |
WEEK 5
Part a
- Wage and salary tax return
No. of Drivers
Cost($)
cost per driver = cost/ no of drivers
8000
60000
7.5
2000
75000
37.5
8000
600000
75
400000
120000
0.3
10000
90000
9
6000
180000
30
6000
90000
15
10000
30000
3
- Appropriation of cost
Salaried & Wages Client
Business Clients
Follow up Calls
60000
75000
Missing data
600000
Input Data
48000
72000
Verify Return
90000
90000
Rectify Errors
90000
Submit Return
24000
6000
Print Return
72000
18000
Total
294000
951000
Cost/Return
36.75
475.5
Part b
Activity-based costing has been used by the management for cutting off unnecessary costs. This tool helps the users in learning the costs apportioned to every activity and thus, the detection of the activity resulting in unnecessary costs can be learned and worked upon with a lot of ease. It emphasizes a huge focus on cost drivers and the activities that result in the increment of the costs. ABC costing is a more reliable and accurate method used in product or service costing and therefore, leads to better pricing decisions (Brown et al 2017). As seen in the computation, it helps to understand cost drivers and overheads and enables the management to eliminate or minimize them. This tool also helps in improving the product and enhances the consumer-profitability analysis. ABC costing also supports performance management tools and techniques.
References
Brown, J. L., Fisher, J. G., Peffer, S. A., & Sprinkle, G. B 2017, The effect of budget framing and budget-setting process on managerial reporting, Journal of Management Accounting Research, vol. 29, no.1, pp. 31.
Charles, T.S 2012, Cost Accounting: A Managerial Emphasis, Managerial accounting assignment Pearson Education
Drury, C 2011, Cost and management accounting. Andover, Hampshire, UK: South Western Cengage Learning.


