Financial Statement Analysis Of Flight Centre Group
Question
Task:
Part A Reformatted Financial Statements and Financial Analysis (15 %)
•Based on the same company chosen in the group assignment, reformat the company’s financial
statements for the past five years in an excel spreadsheet. Produce an individual professional report
where ratio and cash flow analysis is performed to evaluate the current and past performance of the
company and its sustainability in the future. The report should discuss in details what happened and
why the ratios/cash flows changed. Specifically, the report should include the following discussions:
Ratio analysis (6 marks):
•Calculate and discuss key ratios such as ROE, RNOA, PM, ATO, FLEV and NBC.
•Break down and analyse PM and ATO ratios in further details. Identify and discuss three significant
expense items that have caused major changes in profit margin. Identify and discuss three major
assets or liabilities whose turnover ratios have contributed to the overall change in assets
efficiency.
•Briefly describe the ratios trend. The analysis should elaborate on the economic, industry and
business factors that drive the changes in ratios. The discussion should consistently reflect the
same firm fundamentals identified in the group report.
Cash flow analysis (3 marks):
•Calculate liquidity, solvency and cash flow ratios.
•Analyse financial risk and cash flow management of the company based on ratios.
Overall Report Quality (1 mark):
•The report should be readily comprehensible, condensed and within the word limit. Information
should be collected from various reliable sources to inform analysis and references are properly
cited. Tables and graphs should be used to effectively present information.
Answer
Ratio analysis
In the financial statement analysis, this ratio is measured by dividing the net profit after tax from the turnover of the company. The profit margin is the return the company is getting over its revenue for the period (Davydov 2016).
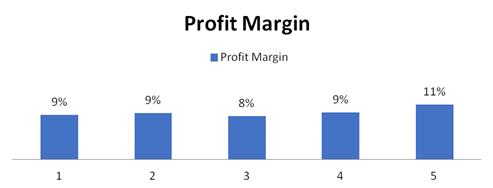
The percent of gain on the sales of the Flight Centre is measured. In the given diagram the starting ratio belongs to 2019 going backward to 2015 (Flight Centre Group Ltd 2019). Thus we can see from the financial statement analysis that the company margin on its total sales is constant and with the given rising sales every year the margin is constant. Thus for making the additional revenue, the company is not required to decrease its profit margin. This shows that the demands for the company products are increasing without any decrease in the price by reducing the margin. The price depends on other factors also being a reduction in the cost of production via more efficient use of resources (Deegan 2016).
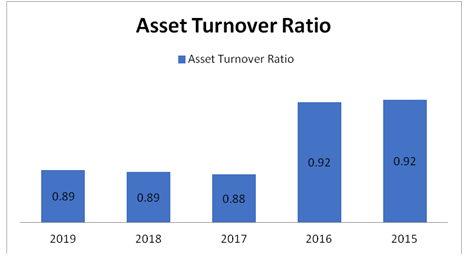
This ratio is measured by dividing the total revenue from the assets invested in the company. This ratio measures how efficiently the assets of the company are being used to generate revenue for the company (Sherman 2015). In the given case of financial statement analysis we can see the net return from assets has reduced from 2015 and 2016 to recent years but the consistency is maintained and much fluctuation is not present. The assets are used efficiently for the generation of sales. Thus the increase in the assets of the company over the years has proportionately increased its revenue to cover the same (Hitchner 2016).
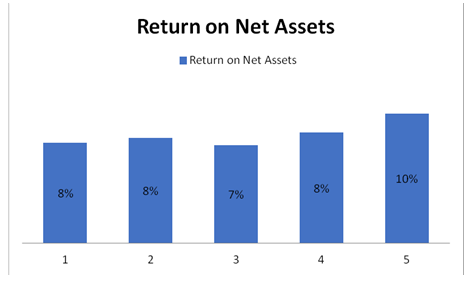
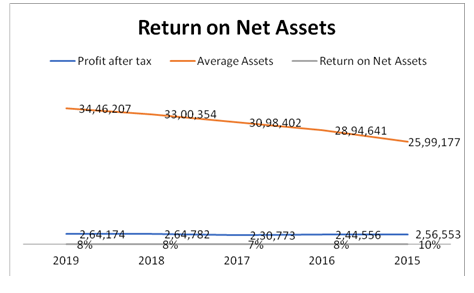
The Return on Net Assets is the measurement of the use of the assets of the company concerning the net profit generated. Since all the assets and income are operational the figures for the above ratio and this ratio will show the same results (Sherman 2015). The difference between the above ratio and the ratio discussed earlier in the financial statement analysis was that in the last ratio we discussed about the generation of the revenue in the current ratio we discuss the profit on such sales. Since the profit margin is constant thus as the sales increased the operating profit also increased (Tosun 2019). Thus this ratio also shows that the company is consistent in its performance.
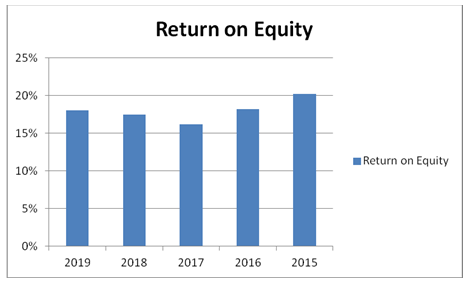
The Return on Equity in the financial statement analysis defines the net income available for the equity investment for the year. This is computed by dividing the income available for equity shareholders by total equity investment including equity share capital, reserves and surplus, etc. The financial data used to conduct financial statement analysis shows the return on equity was decreasing till 2017 thereafter the recovery has started taking place. The shareholders are getting more gain on their invested capital in the company.
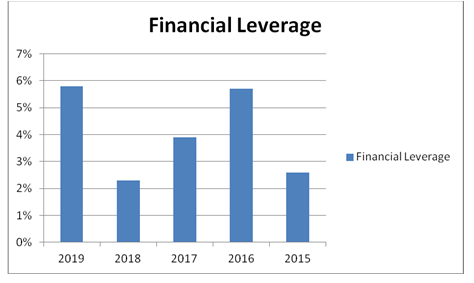
The financial leverage used in financial statement analysis shows the amount of borrowings of the company as compared to its equity. The capital structures of external funds to its internal funds are compared. The leverage is very variable and is highest in the year 2019. The company has increased its dependence in the external borrowing. As per the financial statement analysis, the benefit from the use of external borrowing can be realised only of Cost of Borrowing is less than the return on Investment of the company. This will increase the shareholder’s wealth.
Ratio trend
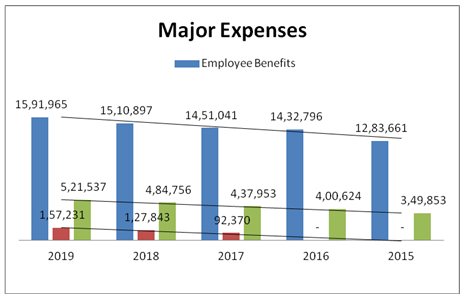
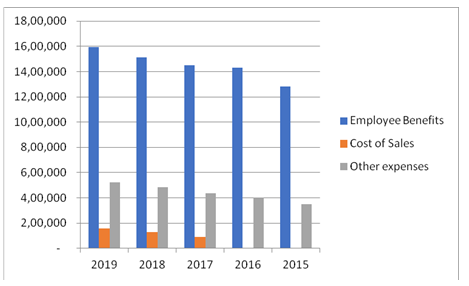
In case of financial statement analysis, these are the major expenses which have lead to the change in the profit margin and changed the most in the recent years. The cost of sales which have incurred from the year 2017 has increased up to 70% and thus is the major reason for decrease in profits from the year 2015. Second major expense is the employee’s benefits expense. It is not only large in volume that is quantity but also in its variations (Flight Centre Group Ltd 2019). In 5 years the expense has increased by 24% and this high amount of expenditure has huge impact on profitability of the company. The other miscellaneous expenses which are considered minor have also varied the most. It has increased by almost 50% over the 5 years (Flight Centre Group Ltd 2019). The given are essential part of the operations and controlling this would not be an easy task but the proper methods should be taken to reduce cost and increase the profit margin.
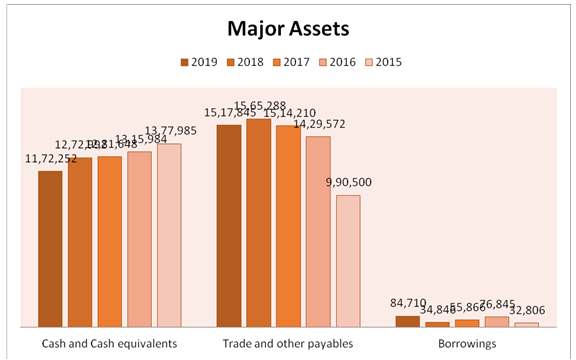
The above chart used for financial statement analysis shows the major assets and liabilities of the company which have largely impacted the asset efficiency of the company. The main assets representing the liquidity of the company that is cash and cash equivalents are showing a decreasing trend which is alarming and if not maintained may lead to defaults in the payments of the company. As against the cash and cash equivalents, the payables and borrowings of the company are showing the increasing trend. The profitability of the company declined and the leverage increased. The company has more payables and even have taken more external borrowings (Morecroft 2015). The financial statement analysis signifies that the high borrowings will increase the burden on the profit of the company and even the interest fixed payments would further impact the liquidity position of the company.
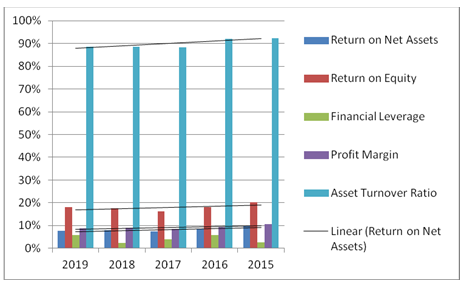
Thus from the given financial statement analysis, the company is maintaining its margin as per the industrial standards but the dependence on the borrowing is impacting the capital structure. Moreover, the trend of the past five years indicates a declining trend in most of the ratio. The required return of the equity shareholders will rise as the leverage of the company increases as compared to other companies in the same industry.
Break down and financial statement analysis
Profitability ratios are a measure of the profitability of the company generated through its operating activities. It displays the capacity of the company in the transformation of the sales into profit generation for the company (Shuli 2011). The profitability ratios also give an idea about the company’s control over its expenses and taxes. The profitability ratio refers to the percentage of the revenue or turnover that is left behind after the company has paid for all its taxes and expenses. Flight Center’s profitability ratios for the last five years are worked out as below:
The net profit after tax has been used for working out this ratio during financial statement analysis. It can be observed that the company had a profitability margin of 11% in the year 2015 which fell to 9% in the succeeding year and then to 8% (Flight Centre Group Ltd 2019).
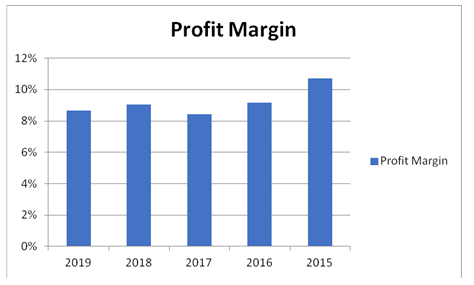
Over the last two years, it has remained more or less constant at 9%. This ratio is used by the creditors and bankers for judging the capability of the company in repayment of their loans and dues. If this ratio is falling, it is an indicator that the expenses of the company are increasing and the company needs to keep over the same to finance its capital and other requirements (Sherman 2015). In the case of Flight Australia, as the profits margin has fallen from 11% to 9% in the last five years, the financial statement analysis of the significant expenses that have contributed to this fall is done.
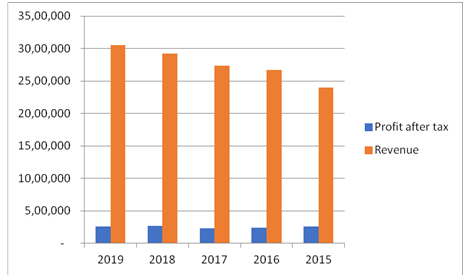
Considering the financial statement analysis, it can be stated that there has been a significant increase in the employee benefits expenses in the last 5 years. It works out to a 24% increase for the year 2019 in comparison to the year 2015. The reason for the same can be attributed to the general price rise of commodities and services over the world in the last few years. The second significant expense item is the cost of sales which has been incorporated as a separate expense item from the year 2017 and onwards (Flight Centre Group Ltd 2019). In the financial statement analysis of last three years itself it has witnessed an increase of 70% which is pretty high in this arena. The item of other expenses has increased by 49% in the year 2019 when compared to the year 2015. The company has certainly added new items under this category and it has also led to a significant price increase in total. Thus the combined impact of these expenses has brought down the net profit margin of the company.
Asset Turnover Ratios
This is another significant ratio considered in the financial statement analysis to analyze how effectively the company has been able to utilize its assets and lead to profit generation for the company. It is the comparison of the revenues of the company with the value of the assets to understand the amount of revenue generated for every dollar of asset owned by the company (Pucheta-Martiinez & Garcia-Meca 2019). Companies with a high asset turnover ratio enjoy a good financial standing and reputation in the market. Based on the financial statement analysis of annual reports of Flight Center for the last five years, the asset turnover ratio has been worked out as below:
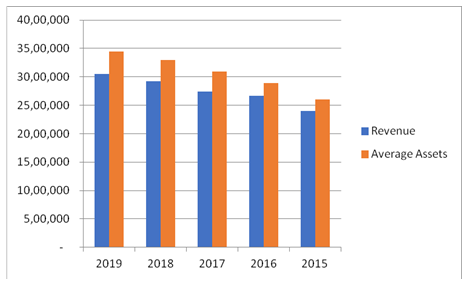
The results imply that for every $1 of the assets, the company is able to generate 89 cents of revenue. It would be significant to note that over the last five years, the assets turnover ratio has remained more or less constant with just a little decrease. The decrease is also not very significant in comparison to the other market conditions and the company performance. Yet financial statement analysis is done on the significant items that have led to this decline in the assets turnover ratio over years.
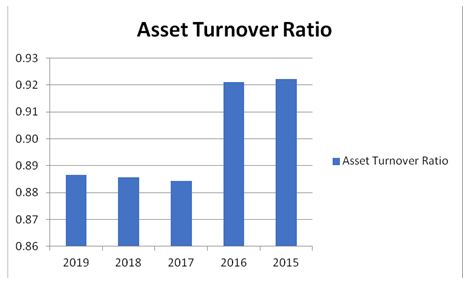
The movement in a few items of assets and liabilities has been analyzed below:
Cash and cash equivalents are the most liquid form of current assets available with any company. It is always necessary to maintain a high quick ratio while performing financial statement analysis to ensure the liquidity of the company. At Flight Center, it can be observed that over the years, there has been a decline in the balance of cash and cash equivalents held by the company.
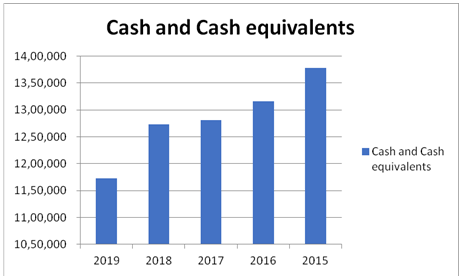
The decline is calculated at 15% in the last five years. The reason for the same can be attributed to the company’s increasing obligations to meet its operating expenses and the cash required for funding its working capital requirements (Flight Centre Group Ltd 2019). The company should still strive towards maintaining a high amount of cash and cash equivalents by proper financial statement analysis.
Trade and other payables refer to the current liabilities that are repayable in less than a year’s time. There has been an increase of 53% in the balance of trade and other payables in the last five years. This also contributes towards the decrease in the current assets and subsequently has an impact on the assets turnover ratio.
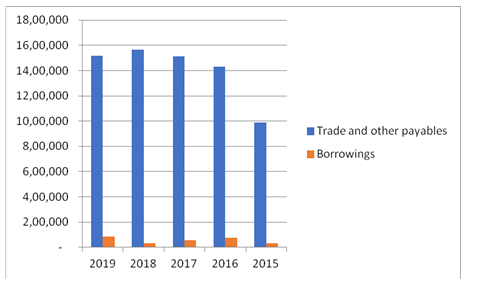
Borrowings are usually short term (current) and long term (non-current). The table above shows the comparison of the current borrowings that refers to short term liabilities. According to the financial statement analysis, there has been a significant increase in this balance of borrowings over the last five years and this increase is worked out as 158%. This item has a significant impact on the decrease in the assets turnover ratio.
Financial statement analysis: Cash flow analysis
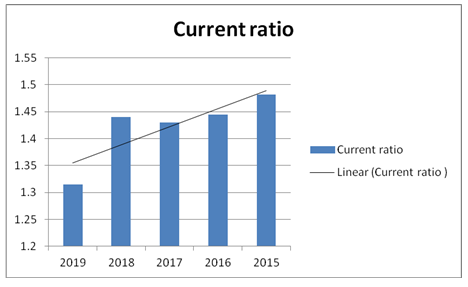
Liquidity ratios: An ideal current ratio is considered to be around 1.33, As per the ratios calculated, we see that the current ratio is appropriate and sufficient enough to cover its current liabilities (Peirson et al 2015). The company current assets are sufficient and the working capital in the company is good. The company is perfectly using its working capital. A 1:1 or slightly higher ratio is considered to be an ideal quick ratio. The company has a less than 1:1 ratio which shows that the company liquid assets are not sufficient to cover its entire current liabilities. There is a lack of liquid assets in the company. Lastly, the cash ratio represents the ratio of cash and marketable securities and current liabilities. This ratio shows the company’s ability to repay its current liabilities using cash and its equivalents like marketable securities. In this case of financial statement analysis, the cash ratio is below one which shows that company cash and its equivalents are not sufficient to pay off current liabilities.
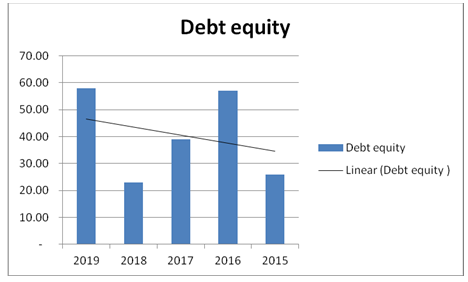
Solvency ratios: These ratios depict the company's financial statement analysis and ability to pay off its debts. Debts include short term and long term debts. The first ratio is the ratio of long term debts and total equity. This ratio is 0.07 which shows that the company Long term debts are negligible in comparison to the total equity of the company. Next is the ratio of Total Debt and Total equity which is 0.15. This ratio indicates that the company’s capital is healthy and the company does not require long or short term debts for business operations (Mersland & Urgeghe 2013). Next ratio in this segment is the ratio of Total debt and total assets which is a paltry ratio of 0.05. This indicates that the company assets are owned by the company and there are hardly any loans against it. Next ratio is financial leverage ratio which is Total assets and total equity. This ratio based on the financial statement analysis is approx 2.39 which shows that the company has more than twice the capital/equity of the company. The Company’s financial health is very good the company has got quite a good amount of retained earnings as well. The proprietary ratio is the opposite of financial leverage and is the ratio of total equity upon total assets. This ratio shows that equity is 42 % of total assets.
Cash flow ratios: These ratios for financial statement analysis show the cash flows of the company which are equally important in business. The current liability coverage ratio which is cash flow from operating activities upon average current liabilities is quite low at 0.16 which shows that the operating activities are not producing sufficient cash to cover its current liabilities, Next is Share price upon cash flows per share which comes around 15.05 which shows that the company has better value. Even the top S&P 500 companies have this ratio around 14-15. Next is cash flow margin ratio which suggests the company ability to convert its sales in cash flows (Carlon 2019). The company is not able to convert its sales into cash flows; its ratio is quite less at around 0.06 which is very less. The last ratio used in financial statement analysis is Cash flow coverage ratio which is suggestive the company's capacity to use its cash flows from operations to pay off its debts (Carlon 2019). The company does not have much of debts while its cash flows are sufficient and cover its debts by 1.5 times approx. This indicates a healthy financial situation for the company.
References
Carlon, S., 2019, Financial accounting: reporting, analysis and decision making. Financial statement analysis 6th ed. Milton, QLD John Wiley and Sons Australia, Ltd
Davydov, D 2016, Debt structure and corporate performance in emerging markets. Research in International Business and Finance, vol. 38,pp. 299-311.
Deegan, C. M 2016, Financial accounting, McGraw-Hill Education.
Flight Centre Group Ltd 2015, Flight Centre Group Ltd 2015annual report & accounts, viewed 15 May 2020, https://www.fctgl.com/wp-content/uploads/2017/08/2015-Annual-Report.pdf
Flight Centre Group Ltd 2016, Flight Centre Group Ltd 2016 annual report & accounts, viewed 15 May 2020, http://www.annualreports.com/Company/flight-centre-travel-group-ltd
Flight Centre Group Ltd 2017, Flight Centre Group Ltd 2017 annual report & accounts, viewed 15 May 2020, https://www.fctgl.com/wp-content/uploads/2017/09/Flight-Centre-Travel-Group-Annual-Report-2017.pdf
Flight Centre Group Ltd 2018, Flight Centre Group Ltd 2018 annual report & accounts, viewed 15 May 2020, https://www.fctgl.com/wp-content/uploads/2018/09/Computershare-FLT-Final-Annual-Report.pdf
Flight Centre Group Ltd 2019, Flight Centre Group Ltd 2019 annual report & accounts, viewed 15 May 2020, https://www.fctgl.com/wp-content/uploads/2019/10/FLT-Annual-Report-FY19.pdf
Hitchner, J. R 2016, Financial valuation, John Wiley & Sons, Incorporated.
Mersland, R., & Urgeghe, L 2013, International Debt Financing and Performance of Microfinance Institutions, Strategic Change vol. financial statement analysis 22, pp. 36-47,
Morecroft, JD 2015, Strategic modelling and business dynamics: A feedback systems approach, John Wiley & Sons, Hoboken,
Peirson, G, Brown, R., Easton, S, Howard, P. & Pinder, S 2015, Finance, 12th ed. North Ryde: McGraw-Hill Australia.
Pucheta-Martiinez, M. & Garcia-Meca, E 2019, Monitoring, corporate performance and institutional directors. Australian Accounting Review, vol. 29, no. 1, pp. 208-219. doi:10.1111/auar.12262
Sherman, E 2015, A manager's guide to financial analysis : Powerful tools for analyzing the numbers and making the best decisions for your business, Ama Self-Study
Shuli, I 2011, Earnings management and the quality of the financial reporting. Perspective of Innovation in Economics and Buisness (PIEB), vol. 8, no. 2, pp. 45- 48.
Tosun, O 2019, Why do large shareholders adopt a short-term versus a long-term investment horizon in different firms? Financial statement analysis Financial Review, vol. 53, no. 4, pp. 763-800.
Appendix
Balance Sheet
|
Assets |
|||||
|
Fiscal year is July-June. All values AUD Millions. |
2019 |
2018 |
2017 |
2016 |
2015 |
|
Cash & Short Term Investments |
352 |
553 |
535 |
1,466 |
1,458 |
|
Cash Only |
337 |
445 |
426 |
1,316 |
1,378 |
|
Short-Term Investments |
16 |
108 |
109 |
150 |
80 |
|
Cash & Short Term Investments Growth |
-36.30% |
3.42% |
-63.53% |
0.55% |
- |
|
Cash & ST Investments / Total Assets |
10.00% |
16.14% |
16.59% |
48.40% |
51.96% |
|
Total Accounts Receivable |
932 |
868 |
809 |
757 |
661 |
|
Accounts Receivables, Net |
559 |
525 |
762 |
672 |
635 |
|
Accounts Receivables, Gross |
578 |
540 |
775 |
683 |
642 |
|
Bad Debt/Doubtful Accounts |
-18 |
-15 |
-13 |
-11 |
-7 |
|
Other Receivables |
373 |
343 |
46 |
84 |
26 |
|
Accounts Receivable Growth |
7.38% |
7.38% |
6.88% |
14.44% |
- |
|
Accounts Receivable Turnover |
3.28 |
3.37 |
3.39 |
3.45 |
3.57 |
|
Inventories |
2 |
2 |
1 |
2 |
2 |
|
Finished Goods |
- |
- |
- |
- |
2 |
|
Progress Payments & Other |
- |
- |
- |
2 |
- |
|
Other Current Assets |
1,022 |
- |
- |
- |
32 |
|
Prepaid Expenses |
54 |
50 |
42 |
39 |
32 |
|
Miscellaneous Current Assets |
968 |
972 |
951 |
- |
- |
|
Total Current Assets |
2,308 |
2,446 |
2,338 |
2,263 |
2,153 |
|
Net Property, Plant & Equipment |
240 |
248 |
256 |
216 |
196 |
|
Property, Plant & Equipment - Gross |
626 |
585 |
562 |
533 |
466 |
|
Buildings |
34 |
33 |
33 |
32 |
45 |
|
Machinery & Equipment |
592 |
551 |
528 |
502 |
421 |
|
Accumulated Depreciation |
386 |
337 |
305 |
317 |
269 |
|
Buildings |
10 |
9 |
8 |
6 |
8 |
|
Machinery & Equipment |
376 |
328 |
297 |
311 |
261 |
|
Total Investments and Advances |
86 |
- |
- |
- |
17 |
|
LT Investment - Affiliate Companies |
86 |
39 |
69 |
19 |
15 |
|
Other Long-Term Investments |
- |
- |
- |
2 |
2 |
|
Long-Term Note Receivable |
0 |
6 |
5 |
- |
- |
|
Intangible Assets |
769 |
586 |
471 |
448 |
386 |
|
Net Goodwill |
599 |
460 |
372 |
367 |
340 |
|
Net Other Intangibles |
170 |
127 |
100 |
81 |
47 |
|
Other Assets |
19 |
- |
- |
- |
- |
|
Tangible Other Assets |
19 |
5 |
2 |
- |
- |
|
Total Assets |
3,524 |
3,425 |
3,223 |
3,029 |
2,806 |
|
Assets - Total - Growth |
2.89% |
6.28% |
6.41% |
7.95% |
- |
|
Asset Turnover |
0.88 |
- |
- |
- |
- |
|
Return On Average Assets |
7.59% |
- |
- |
- |
- |
|
Liabilities & Shareholders' Equity |
|||||
|
All values AUD Millions. |
2019 |
2018 |
2017 |
2016 |
2015 |
|
ST Debt & Current Portion LT Debt |
85 |
35 |
56 |
77 |
33 |
|
Short Term Debt |
12 |
10 |
56 |
77 |
17 |
|
Current Portion of Long Term Debt |
72 |
25 |
- |
- |
16 |
|
Accounts Payable |
1,458 |
1,448 |
1,386 |
1,311 |
943 |
|
Accounts Payable Growth |
0.67% |
4.48% |
5.76% |
38.96% |
- |
|
Income Tax Payable |
11 |
20 |
8 |
9 |
6 |
|
Other Current Liabilities |
202 |
- |
- |
- |
470 |
|
Accrued Payroll |
101 |
93 |
83 |
79 |
64 |
|
Miscellaneous Current Liabilities |
100 |
102 |
102 |
91 |
406 |
|
Total Current Liabilities |
1,755 |
1,699 |
1,635 |
1,567 |
1,453 |
|
Current Ratio |
1.31 |
1.44 |
1.43 |
1.44 |
1.48 |
|
Quick Ratio |
1.31 |
1.44 |
1.43 |
1.44 |
1.48 |
|
Cash Ratio |
0.2 |
0.33 |
0.33 |
0.94 |
1 |
|
Long-Term Debt |
100 |
1 |
- |
- |
- |
|
Long-Term Debt excl. Capitalized Leases |
100 |
1 |
- |
- |
- |
|
Non-Convertible Debt |
100 |
1 |
- |
- |
- |
|
Provision for Risks & Charges |
48 |
41 |
37 |
31 |
36 |
|
Deferred Taxes |
-56 |
-58 |
-42 |
-46 |
-36 |
|
Deferred Taxes - Credit |
47 |
38 |
39 |
36 |
18 |
|
Deferred Taxes - Debit |
103 |
96 |
82 |
81 |
54 |
|
Other Liabilities |
111 |
- |
- |
- |
29 |
|
Other Liabilities (excl. Deferred Income) |
63 |
76 |
60 |
34 |
29 |
|
Deferred Income |
48 |
56 |
23 |
16 |
- |
|
Total Liabilities |
2,062 |
- |
- |
- |
1,536 |
|
Total Liabilities / Total Assets |
58.51% |
0.00% |
0.00% |
0.00% |
54.74% |
|
Common Equity (Total) |
1,462 |
1,510 |
1,429 |
1,346 |
1,270 |
|
Common Stock Par/Carry Value |
406 |
404 |
403 |
399 |
396 |
|
Retained Earnings |
1,053 |
1,109 |
1,015 |
923 |
837 |
|
Cumulative Translation Adjustment/Unrealized For. Exch. Gain |
29 |
-8 |
4 |
22 |
28 |
|
Unrealized Gain/Loss Marketable Securities |
0 |
1 |
0 |
0 |
- |
|
Revaluation Reserves |
- |
- |
- |
- |
0 |
|
Other Appropriated Reserves |
-14 |
15 |
8 |
3 |
9 |
|
Treasury Stock |
-12 |
-11 |
-2 |
- |
- |
|
Common Equity / Total Assets |
41.48% |
44.08% |
44.33% |
44.44% |
45.26% |
|
Total Shareholders' Equity |
1,462 |
1,510 |
1,429 |
1,346 |
1,270 |
|
Total Shareholders' Equity / Total Assets |
41.48% |
44.08% |
44.33% |
44.44% |
45.26% |
|
Accumulated Minority Interest |
0 |
5 |
- |
- |
- |
|
Total Equity |
1,462 |
1,515 |
1,429 |
1,346 |
1,270 |
|
Liabilities & Shareholders' Equity |
3,524 |
3,425 |
3,223 |
3,029 |
2,806 |
Income Statement
|
Fiscal year is July-June. All values AUD Millions. |
2019 |
2018 |
2017 |
2016 |
2015 |
|
Sales/Revenue |
3,055 |
2,923 |
2,740 |
2,612 |
2,363 |
|
Sales Growth |
4.53% |
6.69% |
4.89% |
10.53% |
- |
|
Cost of Goods Sold (COGS) incl. D&A |
1,832 |
- |
- |
- |
- |
|
COGS excluding D&A |
1,749 |
1,639 |
1,543 |
- |
- |
|
Depreciation & Amortization Expense |
83 |
78 |
75 |
67 |
54 |
|
Depreciation |
64 |
65 |
61 |
56 |
47 |
|
Amortization of Intangibles |
19 |
14 |
14 |
10 |
7 |
|
COGS Growth |
0.00% |
- |
- |
- |
- |
|
Gross Income |
1,223 |
1,206 |
1,121 |
- |
- |
|
Gross Income Growth |
1.43% |
7.57% |
0.00% |
- |
- |
|
Gross Profit Margin |
40.03% |
- |
- |
- |
- |
|
SG&A Expense |
880 |
- |
- |
- |
1,781 |
|
Other SG&A |
880 |
828 |
795 |
1,997 |
1,781 |
|
SGA Growth |
0.00% |
- |
- |
0.00% |
- |
|
EBIT |
344 |
- |
- |
- |
528 |
|
Unusual Expense |
28 |
- |
- |
- |
0 |
|
Non Operating Income/Expense |
27 |
2 |
-2 |
-178 |
-165 |
|
Non-Operating Interest Income |
24 |
25 |
27 |
26 |
30 |
|
Interest Expense |
25 |
- |
- |
- |
27 |
|
Interest Expense Growth |
0.00% |
- |
- |
0.00% |
- |
|
Gross Interest Expense |
25 |
25 |
28 |
28 |
27 |
|
Pretax Income |
342 |
362 |
323 |
344 |
366 |
|
Pretax Income Growth |
-5.45% |
12.05% |
-6.07% |
-6.03% |
- |
|
Pretax Margin |
11.20% |
- |
- |
- |
- |
|
Income Tax |
79 |
99 |
95 |
100 |
110 |
|
Income Tax - Current Domestic |
77 |
108 |
90 |
117 |
104 |
|
Income Tax - Deferred Domestic |
2 |
-8 |
5 |
-17 |
5 |
|
Equity in Affiliates |
1 |
2 |
2 |
1 |
0 |
|
Consolidated Net Income |
264 |
265 |
231 |
245 |
257 |
|
Minority Interest Expense |
0 |
1 |
- |
- |
- |
|
Net Income |
264 |
- |
- |
- |
257 |
|
Net Income Growth |
0.00% |
- |
- |
0.00% |
- |
|
Net Margin |
8.64% |
- |
- |
- |
- |
|
Net Income After Extraordinaries |
264 |
0 |
0 |
0 |
257 |
|
Net Income Available to Common |
264 |
- |
- |
- |
257 |
|
EPS (Basic) |
2.36 |
2.35 |
2.06 |
2.18 |
2.29 |
|
EPS (Basic) Growth |
0.20% |
14.27% |
-5.73% |
-4.83% |
- |
|
Basic Shares Outstanding |
112 |
112 |
112 |
112 |
112 |
|
EPS (Diluted) |
2.34 |
2.34 |
2.05 |
2.18 |
2.29 |
|
EPS (Diluted) Growth |
0.12% |
14.13% |
-6.00% |
-4.72% |
- |
|
Diluted Shares Outstanding |
113 |
113 |
113 |
112 |
112 |
|
EBITDA |
427 |
- |
- |
- |
582 |
|
EBITDA Growth |
0.00% |
- |
- |
0.00% |
- |
|
EBITDA Margin |
13.96% |
- |
- |
- |
- |
|
EBIT |
344 |
- |
- |
- |
528 |
Cash flow Statement
|
Operating activities |
|||||
|
Fiscal year is July-June. All values AUD Thousands. |
2019 |
2018 |
2017 |
2016 |
2015 |
|
Net Income before Extra ordinaries |
2,64,174.00 |
2,64,782.00 |
2,30,773.00 |
2,44,556.00 |
2,56,553.00 |
|
Net Income Growth |
-0.23% |
14.74% |
-5.64% |
-4.68% |
- |
|
Depreciation, Depletion & Amortization |
82,370.00 |
77,802.00 |
74,975.00 |
66,091.00 |
54,103.00 |
|
Depreciation and Depletion |
63,069.00 |
64,222.00 |
61,030.00 |
55,893.00 |
46,703.00 |
|
Amortization of Intangible Assets |
19,301.00 |
13,580.00 |
13,945.00 |
10,198.00 |
7,400.00 |
|
Deferred Taxes & Investment Tax Credit |
-106 |
-12,861.00 |
2,045.00 |
-16,578.00 |
4,823.00 |
|
Deferred Taxes |
-106 |
-12,861.00 |
2,045.00 |
-16,578.00 |
4,823.00 |
|
Other Funds |
-1,577.00 |
-3,043.00 |
730 |
37,195.00 |
-16,063.00 |
|
Funds from Operations |
3,44,861.00 |
3,26,680.00 |
3,08,523.00 |
3,31,264.00 |
2,99,416.00 |
|
Changes in Working Capital |
-65,410.00 |
-11,810.00 |
-13,169.00 |
25,969.00 |
63,786.00 |
|
Receivables |
- |
- |
- |
-12,033.00 |
-72,708.00 |
|
Inventories |
-34 |
-407 |
490 |
138 |
-739 |
|
Accounts Payable |
-26,470.00 |
41,070.00 |
- |
23,470.00 |
1,44,047.00 |
|
Income Taxes Payable |
-13,575.00 |
12,657.00 |
-14,180.00 |
7,308.00 |
-11,891.00 |
|
Other Assets/Liabilities |
-25,331.00 |
-65,130.00 |
521 |
7,086.00 |
5,077.00 |
|
Net Operating Cash Flow |
2,79,451.00 |
- |
- |
- |
3,63,202.00 |
|
Net Operating Cash Flow Growth |
0.00% |
- |
- |
0.00% |
- |
|
Net Operating Cash Flow / Sales |
9.15% |
0.00% |
0.00% |
0.00% |
15.37% |
|
Investing Activities |
|||||
|
All values AUD Thousands. |
2019 |
2018 |
2017 |
2016 |
2015 |
|
Capital Expenditures |
-1,00,982.00 |
- |
- |
- |
-82,850.00 |
|
Capital Expenditures (Fixed Assets) |
-53,352.00 |
-50,957.00 |
-75,786.00 |
-93,852.00 |
-72,496.00 |
|
Capital Expenditures (Other Assets) |
-47,630.00 |
-36,326.00 |
-28,338.00 |
-27,136.00 |
-10,354.00 |
|
Capital Expenditures Growth |
0.00% |
- |
- |
0.00% |
- |
|
Capital Expenditures / Sales |
-3.31% |
0.00% |
0.00% |
0.00% |
-3.51% |
|
Net Assets from Acquisitions |
-1,44,937.00 |
-60,019.00 |
-9,646.00 |
-55,895.00 |
-527 |
|
Sale of Fixed Assets & Businesses |
- |
- |
- |
17,201.00 |
- |
|
Purchase/Sale of Investments |
36,932.00 |
- |
- |
- |
-31,577.00 |
|
Purchase of Investments |
-75,946.00 |
-2,692.00 |
-54,100.00 |
-1,41,175.00 |
-39,342.00 |
|
Sale/Maturity of Investments |
1,12,878.00 |
3,017.00 |
11,780.00 |
10,029.00 |
7,765.00 |
|
Other Uses |
-9,883.00 |
- |
- |
- |
- |
|
Net Investing Cash Flow |
-2,18,870.00 |
- |
- |
- |
-1,14,954.00 |
|
Net Investing Cash Flow Growth |
0.00% |
- |
- |
0.00% |
- |
|
Net Investing Cash Flow / Sales |
-7.16% |
0.00% |
0.00% |
0.00% |
-4.86% |
|
Financing Activities |
|||||
|
All values AUD Thousands. |
2019 |
2018 |
2017 |
2016 |
2015 |
|
Cash Dividends Paid - Total |
-3,19,441.00 |
-1,55,629.00 |
-1,38,339.00 |
-1,58,354.00 |
-1,53,108.00 |
|
Common Dividends |
-3,19,441.00 |
-1,55,629.00 |
-1,38,339.00 |
-1,58,354.00 |
-1,53,108.00 |
|
Change in Capital Stock |
-3,967.00 |
- |
- |
- |
4,697.00 |
|
Repurchase of Common & Preferred Stk. |
-9,837.00 |
-13,449.00 |
-2,816.00 |
- |
- |
|
Sale of Common & Preferred Stock |
5,870.00 |
5,147.00 |
5,614.00 |
3,534.00 |
4,697.00 |
|
Proceeds from Stock Options |
5,870.00 |
5,147.00 |
5,614.00 |
3,534.00 |
4,697.00 |
|
Issuance/Reduction of Debt, Net |
1,48,686.00 |
- |
- |
- |
-17,426.00 |
|
Other Funds |
-346 |
- |
- |
- |
- |
|
Other Uses |
-346 |
-35 |
- |
- |
- |
|
Net Financing Cash Flow |
-1,75,068.00 |
- |
- |
- |
-1,65,837.00 |
|
Net Financing Cash Flow Growth |
0.00% |
- |
- |
0.00% |
- |
|
Net Financing Cash Flow / Sales |
-5.73% |
0.00% |
0.00% |
0.00% |
-7.02% |
|
Exchange Rate Effect |
13,747.00 |
9,648.00 |
-11,853.00 |
-18,541.00 |
33,892.00 |
|
Net Change in Cash |
-1,00,740.00 |
-8,656.00 |
-33,738.00 |
-62,599.00 |
1,16,303.00 |
|
Free Cash Flow |
2,26,099.00 |
- |
- |
- |
2,90,706.00 |
|
Free Cash Flow Growth |
0.00% |
- |
- |
0.00% |
- |
|
Free Cash Flow Yield |
-2.22% |
- |
- |
- |
- |
Ratio computation
|
(in $'000) |
|||||
|
Year ended 30 June |
|||||
|
2019 |
2018 |
2017 |
2016 |
2015 |
|
|
Profit after tax |
2,64,174 |
2,64,782 |
2,30,773 |
2,44,556 |
2,56,553 |
|
Revenue |
30,55,268 |
29,22,985 |
27,39,734 |
26,66,176 |
23,96,989 |
|
Profit Margin |
9% |
9% |
8% |
9% |
11% |
|
(in $'000) |
|||||
|
Year ended 30 June |
|||||
|
2019 |
2018 |
2017 |
2016 |
2015 |
|
|
Employee Benefits |
15,91,965 |
15,10,897 |
14,51,041 |
14,32,796 |
12,83,661 |
|
Cost of Sales |
1,57,231 |
1,27,843 |
92,370 |
- |
- |
|
Other expenses |
5,21,537 |
4,84,756 |
4,37,953 |
4,00,624 |
3,49,853 |
|
(in $'000) |
|||||
|
Year ended 30 June |
|||||
|
2019 |
2018 |
2017 |
2016 |
2015 |
|
|
Revenue |
30,55,268 |
29,22,985 |
27,39,734 |
26,66,176 |
23,96,989 |
|
Average Assets |
34,46,207 |
33,00,354 |
30,98,402 |
28,94,641 |
25,99,177 |
|
Asset Turnover Ratio |
0.89 |
0.89 |
0.88 |
0.92 |
0.92 |
|
(in $'000) |
|||||
|
Year ended 30 June |
|||||
|
2019 |
2018 |
2017 |
2016 |
2015 |
|
|
Cash and Cash equivalents |
11,72,252 |
12,72,992 |
12,81,648 |
13,15,984 |
13,77,985 |
|
Trade and other payables |
15,17,845 |
15,65,288 |
15,14,210 |
14,29,572 |
9,90,500 |
|
Borrowings |
84,710 |
34,846 |
55,866 |
76,845 |
32,806 |
|
(in $'000) |
|||||
|
Year ended 30 June |
|||||
|
2019 |
2018 |
2017 |
2016 |
2015 |
|
|
Profit after tax |
2,64,174 |
2,64,782 |
2,30,773 |
2,44,556 |
2,56,553 |
|
Average Assets |
34,46,207 |
33,00,354 |
30,98,402 |
28,94,641 |
25,99,177 |
|
Return on Net Assets |
8% |
8% |
7% |
8% |
10% |
|
Year ended 30 June |
|||||
|
2019 |
2018 |
2017 |
2016 |
2015 |
|
|
Profit after tax |
2,64,174 |
2,64,782 |
2,30,773 |
2,44,556 |
2,56,553 |
|
Revenue |
30,55,268 |
29,22,985 |
27,39,734 |
26,66,176 |
23,96,989 |
|
Profit Margin |
9% |
9% |
8% |
9% |
11% |
|
(in $'000) |
|||||
|
Year ended 30 June |
|||||
|
2019 |
2018 |
2017 |
2016 |
2015 |
|
|
Employee Benefits |
15,91,965 |
15,10,897 |
14,51,041 |
14,32,796 |
12,83,661 |
|
Cost of Sales |
1,57,231 |
1,27,843 |
92,370 |
- |
- |
|
Other expenses |
5,21,537 |
4,84,756 |
4,37,953 |
4,00,624 |
3,49,853 |
|
(in $'000) |
|||||
|
Year ended 30 June |
|||||
|
2019 |
2018 |
2017 |
2016 |
2015 |
|
|
Revenue |
30,55,268 |
29,22,985 |
27,39,734 |
26,66,176 |
23,96,989 |
|
Average Assets |
34,46,207 |
33,00,354 |
30,98,402 |
28,94,641 |
25,99,177 |
|
Asset Turnover Ratio |
0.89 |
0.89 |
0.88 |
0.92 |
0.92 |
|
(in $'000) |
|||||
|
Year ended 30 June |
|||||
|
2019 |
2018 |
2017 |
2016 |
2015 |
|
|
Cash and Cash equivalents |
11,72,252 |
12,72,992 |
12,81,648 |
13,15,984 |
13,77,985 |
|
Trade and other payables |
15,17,845 |
15,65,288 |
15,14,210 |
14,29,572 |
9,90,500 |
|
Borrowings |
84,710 |
34,846 |
55,866 |
76,845 |
32,806 |


