Finance Assignment: Financial Analysis Report for AGL Energy
Question
Task
Select a company that is currently listed on the ASX. Write a Financial Analysis Report on finance assignment that interprets the company’s most recent annual report. This report will need to be written for a stakeholder (external investor or internal manager).
Answer
Executive Summary
The finance assignment aims to effectively inform the economic efficacy of the business while highlighting their stronger and weaker points. For doing the needful, a brief ratio analysis would be performed based on the statement of finance for the last two years along with the interpretation of specific non-economic KPIs that would be able of informing about the organization's success and failure in the short run. The assignment has informed that the financial efficacy as well as the market dominance of AGL Energy Limited is able of attracting investors to invest in the business for gaining profits in the short run.
Introduction
The discussed company AGL Energy limited is based in Australia that is involved in distribution as well as extraction of power and gas for both suburban and marketable purposes. The company potentially creates power from energy stations using hydroelectricity, thermal energy, solar energy, natural gas, gas storage sources and coal seam gases.
The company can create value for its shareholders as well as external and internal stakeholders through several sources of capital funding. Few of the most permanent stakeholders of the organisation are their people, customers (Agl.com.au. 2019). Investors and communities that efficient invest in the business for supporting the long-term operations of the company. The following chart potentially demonstrates the primary drivers of the company.
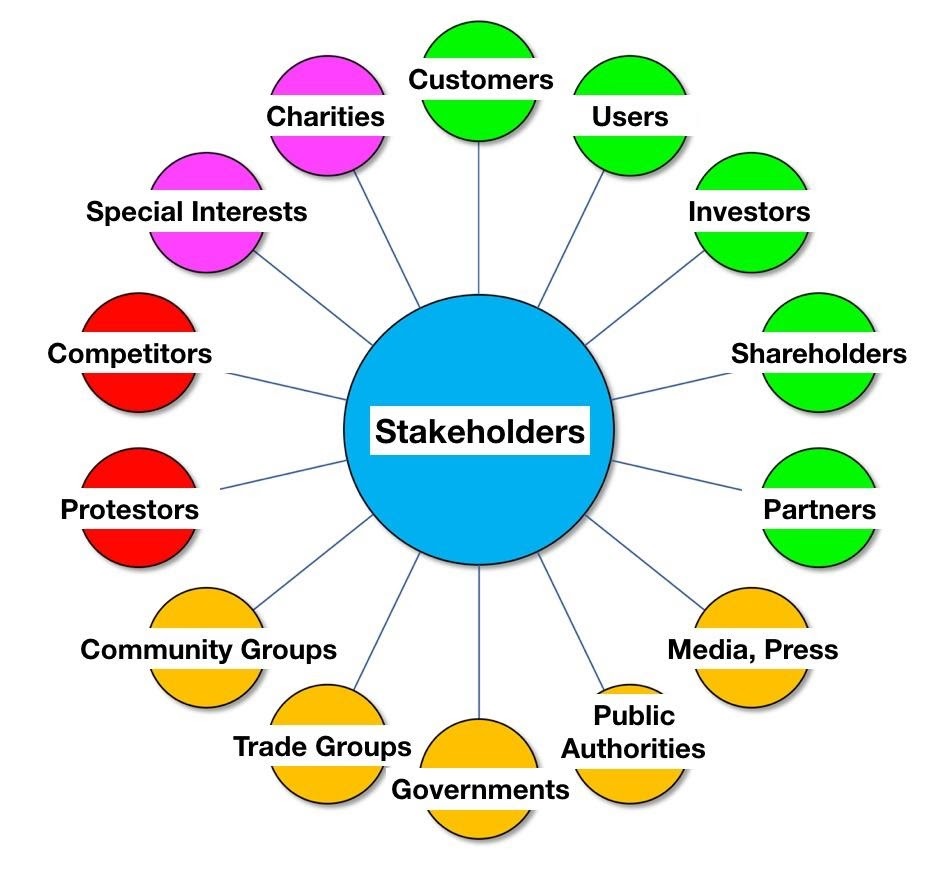
Source: Agl.com.au. 2019
The paper aims to effectively inform the economic efficacy of the business while highlighting their stronger and weaker points. For doing the needful, a short interpretation would be performed based on the statement of finance for the last two years along with the interpretation of specific non-economic KPIs that would be able of informing about the organization's success and failure in the short run.
Ration Analysis
Ratios of finance
Net profit margin-
Following is the net profit ratio of the discussed company for the year 2019 and 2018:
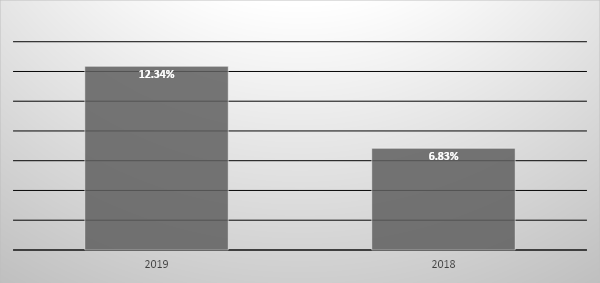
According to the above graph, the income margin of the company exhibits a declining trend that informs that the capability of the business in retaining profit after the expenses have been met is declining steadily (Meijer et al., 2019). This is the reason because of the massive increase in operational costs primarily due to a decline in sales revenue or inflation, decreasing the business's expertise in meeting expenses. Hence the net profit of the value 6.83% has suggested that among the total sales created by the company in the year 2019, the company was successful in retaining 6.83% in net profit.
Current Ratio
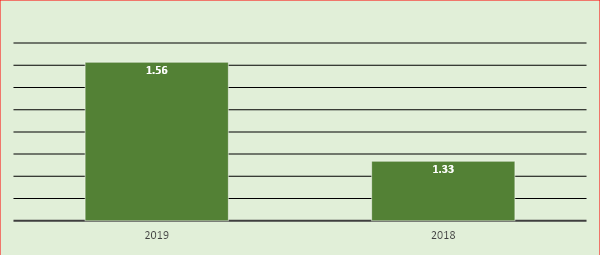
In general terms, the current ratio exceeding one exhibits that the marketable assets of the company are comparatively higher than the company's interim debts, and this denotes that the business would not have to face much trouble while covering their expenses (Rahmantio, Saifi & Nurlaily, 2018). Thus, as represented by the above chart, the current permission of AGL is higher than one for both the year informing the liquidity position of the company to be healthier and hence it also informs about the ability of the company to cover all of its short-term obligations with the capacity of raising external funding from other sources.
Total Asset Turnover Ratio
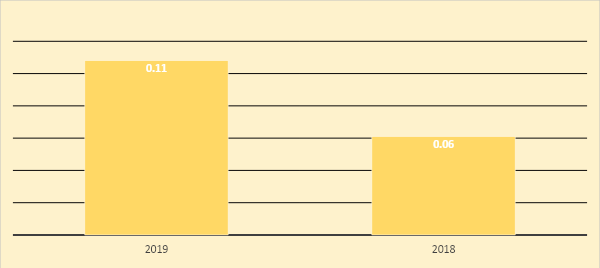
In general, terms if the total asset turnover ratio is 2.5 or above, then it is considered to be a beneficial turnover ratio. If the value is lesser than that, then it could be said that the assets of the company are unable to generating essential income for the business (Kyriakarakos & Papadakis, 2018). According to the chart provided above it could be seen that the ROTA of AGL exhibits a declining trend and is very much below the standard of the industry which represents that company is unable of extract more incredible wealth using all the assets of the company. This could be a result of the decrease in demand for production of an asset or the decline in the capacity of production due to tear and wear.
Return on Equity
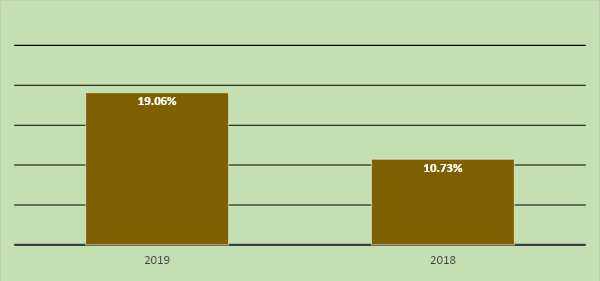
In general industry standards, the ROE of more than 25% is considered to be a beneficial return on equity, and anything below than that value is considered below industry standards (Canstar Blue 2018). Thus, the graph above shows that the ROE of the company has decreased to a considerable extent within a brief period, which means that the potential of the management for the generation of profit through equity is declining gradually.
Non-financial indicators
The indicators of non-financial critical performance are essential for measuring the performance of the indicators that would be leading in the future in comparison to the financial indicators in which the company is lagging (Egam, Ilat & Pangerapan, 2017). The primary non-financial ration for the company is people management and customer satisfaction.
The company can provide maximum satisfaction to stakeholders the internal and external stakeholders through the various medium of capital funding.
Very prominent stakeholders for the company are their people, customers, investors and communities who invest in the company's several short-term operations.
Trend Analysis
Income statement
The statement of income of the discussed organization for the year 2019 has been able of setting a high benchmark for the profitability of the company while they prepare themselves for an exciting future. The profit that was incurred after the payment of taxes that is measured actual earnings is amounted to be $1040 million and the operating cash flow valued to an amount of $1599 Million.
Balance Sheet
The performance of the company remains marginal with a small increment in the real assets to $14821 million in 2019 from $14633 million in 2018. However, a substantial working capital was retained by the business that amounted in $8438 million in 2019, which was $8301 million in 2018 (Kamar, 2017).
Cash Flow Statement
The equivalents of cash, as well as cash, declined to a significant extent for the end of the year in 2019 which have amounted to $115 million in 2019 from $463 million in 2018. This has mainly occurred due to the decrease in cash from the operational activities and due to the increase in the investment activities and also due to the cash that has been used in financial activities.
Competitor Analysis
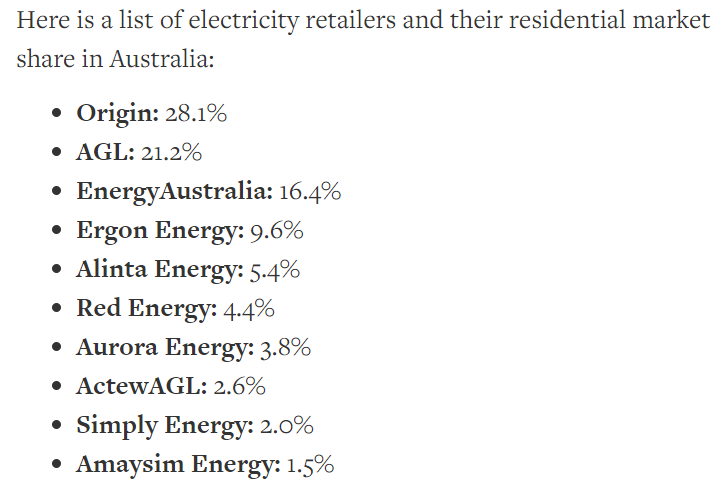
The country has been estimated to generate 77 percent of power through burning coal and 9 percent from hydro-electricity, whereas 5% from wind energy and 3% from solar energy. Thus, some of the major players of AGL in Origin Industry and Energy Australia having the largest market shares across the states that are deregulated (Egam, Ilat & Pangerapan, 2017).
Horizontal and Vertical Analysis
It is evident from the report of 2019 and 2018 that the revenue streams have improved over the period of one year, by 3.36%. However, net income of the business has declined at a staggering rate of 42.79%, fueled by increase in overall expense compared to income. Thorough analysis of Balance sheet revealed that the current assets of the business has declined by 7.97% while total liabilities increased by 9.60%, therefore degrading the liquidity stability of the business in the process. Other noticeable changes involve marginal growth in total equity which would enable the business to fund its operations and keep itself in competitive space.
Conclusion
Going by the financial efficacy as well as the market dominance of the company, the investors could be easily recommended to invest in the operational activities of AGL for gaining a tremendous amount of profit in the long run.
Reference
Agl.com.au. (, 2019). AGL Energy | An Electricity Provider & Gas Supplier | AGL. [online] https://www.agl.com.au/
Egam, G. E., Ilat, V., & Pangerapan, S. (2017). Pengaruh Return on Asset (ROA), Return on Equity (ROE), Net Profit Margin (NPM), dan Earning Per Share (EPS) terhadap Harga Saham Perusahaan yang Tergabung dalam Indeks LQ45 di Bursa Efek Indonesia Periode Tahun 2013-2015. Jurnal EMBA: Jurnal Riset Ekonomi, Manajemen, Bisnis dan Akuntansi, 5(1).
Kamar, K. (2017). Analysis of the effect of return on equity (ROE) and debt to equity ratio (DER) on stock price on cement industry listed in Indonesia stock exchange (IDX) in the year of 2011-2015. IOSR Journal of Business and Management, 19(05), 66-76.
Kyriakarakos, G., & Papadakis, G. (2018). Microgrids for productive uses of energy in the developing world and blockchain: a promising future.
Meijer, L. L. J., Huijben, J. C. C. M., Van Boxstael, A., & Romme, A. G. L. (2019). Barriers and drivers for technology commercialization by SMEs in the Dutch sustainable energy sector. Renewable and Sustainable Energy Reviews, 112, 114-126.
Rahmantio, I., Saifi, M., & Nurlaily, F. (2018). Pengaruh Debt to Equity Ratio, Return on Equity, Return on Asset dan Ukuran Perusahaan Terhadap Nilai Perusahaan (Studi pada Perusahaan Pertambangan yang Terdaftar di Bursa Efek Indonesia Tahun 2012-2016). Jurnal Administrasi Bisnis, 57(1), 151-159.
Appendix
|
Balance Sheet for year ending 30 June, 2019 |
Horizontal Analysis |
Vertical Analysis |
||
|
Particulars |
2019 |
2018 |
2019 |
2019 |
|
Current Asssets |
|
|
|
|
|
Cash and Cash Equivalents |
115 |
463 |
-75.16% |
0.78% |
|
Trade and other receivables |
1703 |
1775 |
-4.06% |
11.49% |
|
Inventories |
388 |
370 |
4.86% |
2.62% |
|
Current tax assets |
89 |
147 |
-39.46% |
0.60% |
|
Other financial assets |
798 |
600 |
33.00% |
5.38% |
|
Other Assets |
303 |
261 |
16.09% |
2.04% |
|
Assets classfied as held for sales |
|
74 |
-100.00% |
|
|
Total Current Assets |
3396 |
3690 |
-7.97% |
22.91% |
|
Non Current Assets |
|
|
0.00% |
|
|
Inventories |
57 |
10 |
470.00% |
0.38% |
|
Other financial Assets |
590 |
448 |
31.70% |
3.98% |
|
Investment in associates and joint ventures |
150 |
100 |
50.00% |
1.01% |
|
property, Plant and Equipment |
6588 |
6757 |
-2.50% |
44.45% |
|
Inrtangible assets |
3740 |
3271 |
14.34% |
25.23% |
|
Deferred tax assets |
261 |
280 |
-6.79% |
1.76% |
|
Other assets |
39 |
77 |
-49.35% |
0.26% |
|
Total Non Current Assets |
11425 |
10943 |
4.40% |
77.09% |
|
Total Assets |
14821 |
14633 |
1.28% |
|
|
Current Liabilities |
|
|
|
|
|
Trade and other Payables |
1556 |
1579 |
-1.46% |
10.50% |
|
Borrowings |
102 |
34 |
200.00% |
0.69% |
|
Provisions |
225 |
233 |
-3.43% |
1.52% |
|
Current Tax Liabilities |
27 |
81 |
-66.67% |
0.18% |
|
Other financial liabilities |
632 |
394 |
60.41% |
4.26% |
|
Other liabilities |
4 |
2 |
100.00% |
0.03% |
|
Total Current Liabilities |
2546 |
2323 |
9.60% |
17.18% |
|
Non Current Liabilities |
|
|
|
|
|
Borrowings |
2748 |
2929 |
-6.18% |
18.54% |
|
Provisions |
481 |
509 |
-5.50% |
3.25% |
|
Deferred tax liabilities |
97 |
|
0.65% |
|
|
Other financial liabilities |
282 |
432 |
-34.72% |
1.90% |
|
Other liabilities |
229 |
139 |
64.75% |
1.55% |
|
Total Non Current Liabilities |
3837 |
4009 |
-4.29% |
25.89% |
|
Total Liabilities |
6383 |
6332 |
0.81% |
43.07% |
|
Net Assets |
8438 |
8301 |
1.65% |
56.93% |
|
Equity |
|
|
|
|
|
Issued Capital |
6223 |
6223 |
0.00% |
41.99% |
|
Reserves |
-33 |
-102 |
-67.65% |
-0.22% |
|
Retained Earnings |
2248 |
2180 |
3.12% |
15.17% |
|
Total Equity |
8438 |
8301 |
1.65% |
56.93% |
|
Income Statement for the year ending 30 June, 2019 |
Horizontal Analysis |
Vertical Analysis |
||
|
Particulars |
2019 |
2018 |
2019 |
2019 |
|
Continuing Operations |
|
|
|
|
|
Revenue |
13246 |
12816 |
3.36% |
|
|
Other Income |
54 |
31 |
74.19% |
0.41% |
|
Expense |
-11236 |
-9854 |
14.02% |
-84.83% |
|
Share of Profits of Associates and Joint Ventures |
33 |
39 |
-15.38% |
0.25% |
|
Profit before net financing costs, depreciation and Amortization |
2097 |
3032 |
-30.84% |
15.83% |
|
Depreciation and Amortization |
-625 |
-568 |
10.04% |
-4.72% |
|
Profit before net financing costs |
1472 |
2464 |
-40.26% |
11.11% |
|
Finance Income |
10 |
10 |
0.00% |
0.08% |
|
Finance Costs |
-203 |
-230 |
-11.74% |
-1.53% |
|
Net Finanace Costs |
-193 |
-220 |
-12.27% |
-1.46% |
|
Profit Before Tax |
1279 |
2244 |
-43.00% |
9.66% |
|
Income Tax Expense |
-374 |
-662 |
-43.50% |
-2.82% |
|
Profit for the period attributable to shareholders of AGL Energy Limited |
905 |
1582 |
-42.79% |
6.83% |


