Finance Assignment Analysing Performance Of Super Retail Group
Question
Task:
You are required to study the annual reports of the designated company over the past three years and present your findings in a business report format. Your business report on finance assignment should evaluate the relative financial performance of the company based on the financial analysis results and propose strategies for future improvements.
Answer
Executive Summary
As presented in this finance assignment, financial ratio calculations of any organisation states about the overall performance of the organisation. The activities related to the profitability states about the approach and practice where the company can easily identify the areas where they need some improvement. However, here the research report analysed the Super Retail Group profitability and performance. Moreover, a peer comparison is also representing here which consider the industry standard. The benchmarking, DuPont analysis and strategies for improvement are suggested here for the organisation. Different graphs and charts are demonstrated here to graphically represent the organisation performance. However, the over financial performance of Super Retail Group stated here to represent the overall performance, market position and weak areas of the organisation.
Introduction
The process of financial analysis states about the activities through which an organisation is able to process the business evaluation process, projects, budgets and the three financial transaction activities. Moreover, it can able to determine the sustainability and the part of process of the organisation. However, the consideration of the financial performance process states about the financial ratios, which are analysed to identify the stable entity, liquidity, solvent ratios and the profitability amount to get the effective monetary investment process.
However, here the organisation Super Retail Group is considered which generally gives service to countries like Australia and New Zealand. The ratio analysis, benchmarking of the company, suggestions about the stability and the analysis of Dupont approach all are represented here.
Financial analysis
According to the liquidity ratio of the last three years it can be stated that the organisation maintains a balanced liquidity formation. However, thesis’s turnover in the year 2018 was 1.40, in the year 2019 1.48 and in the year 2020 it was 1.14 (Superretailgroup.com.au, 2021). The inventory turnover of the organisation states that in the year 2018 the amount was 2.59, in the year 2019 the amount was 7.59 and in the year 2020 the amount was 4.44 (Superretailgroup.com.au, 2021). In the context of the profitability ratio the amount of net margin in the year 2018 was 4.99, in the year 2019 it was 5.14 and in the year 2020 it was 3.90. The EBITDA margin of the organisation was 11.87 in the year 2017, 11.48 in the year 2019 and in the year 2020 it was 19.04 (Superretailgroup.com.au, 2021).
|
Name of ratios |
2018 |
2019 |
2020 |
|
Valuation ratio |
|||
|
Enterprise value to EBITDA = (Earnings + Interest + Income tax + Depreciation)/ Amortization |
6.67 |
6.51 |
4.69 |
|
Enterprise value = (Market capitalisation + Stock preferred + debt outstanding + Minority interest – Cash equivalent and cash) |
1.29B |
1.25B |
1.55B |
|
Price to book ratio = Market price per share / book value per share |
2.06 |
1.99 |
1.80 |
|
Price to cash flow ratio = share price / Cash flow per share |
5.52 |
7.37 |
2.91 |
|
Price to sales ratio = market capitalisation / Annual sales |
0.63 |
0.60 |
0.57 |
|
Price to earnings ratio = Share price / Earnings per share |
12.46 |
11.66 |
14.60 |
|
Profitability ratio |
|||
|
Net margin % = Net profit / total revenue * 100 |
4.99 |
5.14 |
3.90 |
|
EBITDA margin % = (Earnings + Interest + Income tax + Depreciation)/ Amortization |
11.87 |
11.48 |
19.04 |
|
Operating margin % = Operating income/ revenue |
8.77 |
8.21 |
9.05 |
|
Gross margin % = (net sales-COGS)/ Net sales |
44.93 |
45.01 |
44.96 |
|
Return on invested capital % = [ EBIT* (1-tax rate)/ Invested capital] * 100 |
10.59 |
11.41 |
6.87 |
|
Return on equity % = Net income/ Shareholder’s equity |
16.54 |
17.24 |
12.19 |
|
Return on assets % = Net income/ total assets |
6.99 |
7.59 |
4.44 |
|
Liquidity ratio |
|||
|
Asset’s turnover = Net sales/ average total assets |
1.40 |
1.48 |
1.14 |
|
Inventory Turnover = Cost of goods sold/ average inventory |
2.59 |
2.70 |
2.93 |
|
Current ratio = Current assets/ current liabilities |
1.28 |
1.27 |
1.08 |
|
Quick ratio = Current assets – inventory / current liabilities |
0.10 |
0.10 |
0.41 |
|
Solvency ratios |
|||
|
Long term debt to total assets = Short term debt + long term debt + other fixed payments / Equity of shareholders |
0.24 |
0.21 |
0.32 |
|
Debt to assets ratio = total debt / total assets |
0.24 |
0.21 |
0.38 |
|
Debt to equity ratio = Short term debt + long term debt + other fixed payments / Equity of shareholders |
0.57 |
0.48 |
1.20 |
DuPont Analysis
The effective consideration of the DuPont analysis states about the framework which indicates the fundamental analysis of the performance process which was originally popularized by the corporation of DuPont. It is considered as the helpful technology which is generally used to decompose technology to find out the return on equity approach of the organisation (Superretailgroup.com.au, 2021). The effective consideration of the investors approach states about the analysis which can be reflect through the effective comparison of the operational efficiency of two forms (Amiluddin, Baso, Najamuddinand Hamzah 2020). Therefore, it is very much clear that effective consideration of the strength and weakness are addressed through it.
Dupont Analysis = Net profit margin * AT * EM
Where the Net profit margin = Net income/ revenue
AT = Asset turnover
Asset turnover= Sales/ total Average assets
EM = Equity multipliers
Equity Multiplier = Average total assets / Average shareholders’ equity
ROE in 2018 = 16.54 %
ROE in 2019 = 17.24 %
ROE in 2020 12.19 %
Benchmarking
According to the financial health growth of the organisation, it can be easily stated that the Super Retail maintains both the short-term activities and the long-term activities to balance the financial health of the organisation. However, in the context of short-term approach the amount of assets considered by the organisation is $1.11Billion AUD and the liabilities are also AU$1.11 Bn. in the context of long term process the organisation need to consider near about AU$1.89 Bn and liabilities amount is AU$723.30 Million (Superretailgroup.com.au, 2021).
According to the past performance of the organisation, it can be stated that 16% of the growth is considered here for the annual earnings growth activities. The earnings and the revenue history state that the amount considered here is AU$2.788 Billion per year and the earnings amount is AU117.600 million per year (Superretailgroup.com.au, 2021). Therefore, the profit margin of the organisation was 4.2%. According to the Quality earnings analysis it is also stated that Super Retail considers effective earnings which is high quality activities (Andriana et al., 2019). Moreover, growing profit margin states about the current net profit margin whose amount is 7.1%. This amount is higher than the last few years' performance and that is 4.5%. The effective consideration of the past few year’s analysis over annual growth states that 16.0% of the growth is considered for the organisation itself (Superretailgroup.com.au, 2021). Moreover, the industry average growth was 8.9% and the effective market growth of the company is 12.5%.
However, from the above statements, it can be easily stated that Super retail has been considered a healthy growth rate from the last 5 years. The return on equity states that the companying average growth is 19.5% and on the other hand the industry growth was 19.0%. Therefore, it is considered as low by comparison with the industry average amount (Superretailgroup.com.au, 2021). The return on assets value of the organisation considers 9.1% and the industry average standard growth is 8.8%. Therefore, it is very much clear that company performance is good in nature. The effective consideration of the return on capital employed states about the company growth which is 19.6% and the industry average growth is 17.2% (Superretailgroup.com.au, 2021).
According to the research, over the competitors of the organisation, the SGH Retail group has 7000 employees with $1.1 Billion revenue. On the other hand, the organisation David Jones consider 8716 employees with the revenue of $1.4 billion. The organisation Kathmandu Holdings Limited include 1144 employees with $533.1 million revenue. In that context the Super Retail groupconsiders 13000 employees with the amount of revenue like $1.9 billion (Superretailgroup.com.au, 2021).
The critical analysis of the dividend yield of the organisation and the market amount it can be easily stated that 4.8% of the growth is considered by the company. 2.0% of the bottom-line approach is noticed in the context of the market (Fedorková, 2018). The effective 5.0% of the approach is considered by market top line activities and the industry average of the dividend yield is 3.4%. The current pays out to the shareholders states about 49% of the current amount which is considered the paid amount as dividend and earrings amount as retained (Superretailgroup.com.au, 2021).
The compensation analysis process considers that total compensation amount is 1.47 million AUD where other companies in the same industry considers the compensation size near about $1.17 million AUD. However, it is very much clear that Australian compensation amount has increased by more than 20% in the past few years (Basyuni et al., 2020). However, from the above discussion it is very much clear that the company is trying to consider an effective position in the supermarket industry in Australia (Superretailgroup.com.au, 2021).
Graphs of organisation relative performance
According to the below graph it can be stated that average 5 years margins can be detected from it. In the last five years the gross margin of the organisation has increased by 45%. On the other hand, the operating margin of the organisation considers 12% of the growth. The pre-tax margin of the organisation states about 5.77% growth and net profit margin is increased by 4.12% (Superretailgroup.com.au, 2021).
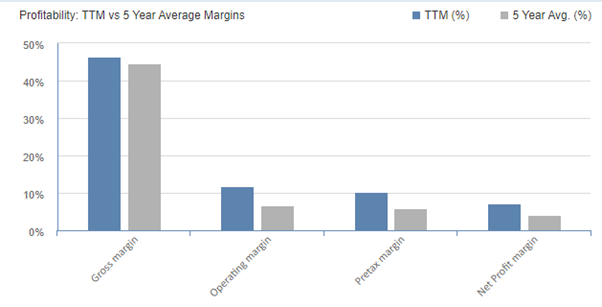
Figure no 1: Graph of Ratios
(Source: Superretailgroup.com.au, 2021)
The effective management approaches growth is also stated here where the considered areas are the return on equity, return on assets, return on investment. However, if the average management effectiveness is considered here then the calculation states that return on equity is increased by 13.77%. On the other hand, return on assets is increased by 7.89% and return on investment process is increased by 12%.
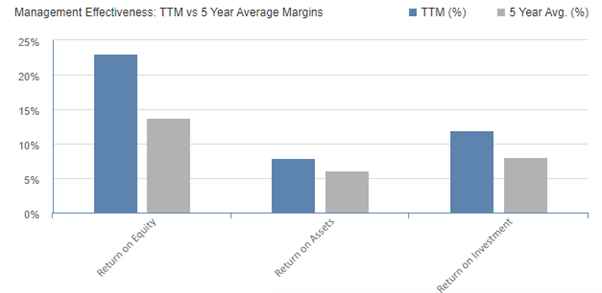
Figure no 2: Graph of management efficiency
(Source: Superretailgroup.com.au, 2021)
According to the effective analysis it can be stated that performance of the last three years can be detected through the consideration of value maintenance by the organisation, dividend policies, health of the organisation, past performance of Super Retail and future growth strategies (Campisi et al., 2019). However Super Retail considers significant and potential financial health. The dividend policies and the past performance measurement is not so bad, but the organisation does not consider any kind of future growth of the process.
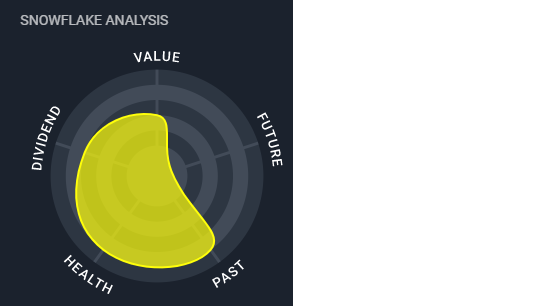
Figure no 3: Snowflake analysis
(Source: Superretailgroup.com.au, 2021)
The organisation PE ratio states that the ratio is below the Australian market because the company's PE ratio is 12.8x but the market standard in Australia is 20.2x. The effective earnings growth of the organisation is 80.4% from the past 5 years. Moreover, from the earnings forecast approach states about the declination which is average of 8.9% for the next3 years (Fauzi et al., 2021). The organisation Super Retail also considers an unstable dividend track record. According to research over the share price of the organisation, it can be stated that Super Retail is less volatile in nature than the Australian stock market and the amount is 75% over the last 3 months. The market performance of the organisation states that the effective return of the organisation is 0.2% where the Australian specialty retail industry considers 0.6% and the overall Australian market considers 0.7%.
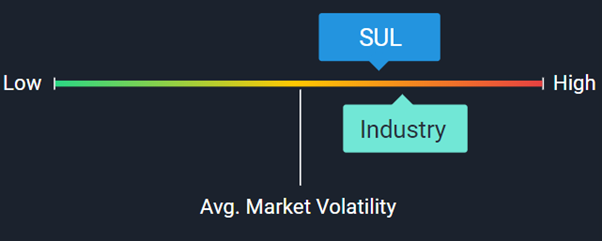
Figure no 4: Market volatility
(Source: Superretailgroup.com.au, 2021)
However, according to the research the organisation considers 34.2% of the overvalued amount, where the current price is AU$13.62 and the Fair value is AU$10.15. Therefore, if it is compared to the Australian market value, then the Super Retail value is lower than it, because Australian standard value is $10.15AUD. According to the Super Retail analysis it is also stated that they consider good value which is based over PE ratio and this amount is 12.8x. On the other hand, Australian Specialty retail industry average is 17.8x.
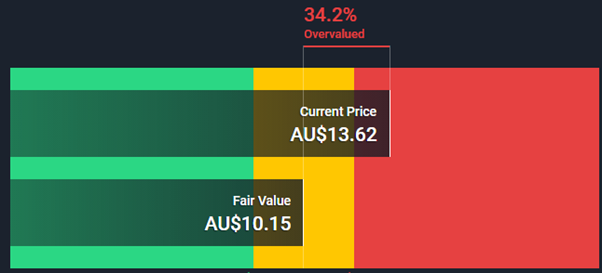
Figure no 5: Dividend value
(Source: Superretailgroup.com.au, 2021)
Strategic suggestion
The strategic suggestion of the organisation states about the sales process of the organisation along with the earnings, balance sheet and the dividend amount of the organisation. However, the effective sales amount of the organisation is $2.83 billion therefore the sales growth of the organisation is 3.6%. The earnings of the organisation in the context of segment of EBITDA is 4.3%. The normalised Net profit after the tax payable process is $154.1 million. Therefore, as per the above amount it can be easily stated that the organisation considers some effective primary value levers (De Oliveira Santini et al., 2019). The primary value levers of the organisation consider effective growth of the annual customer value of the organisation. The effective implementation of the Omni Retailer approaches and the ensuring organic approach of growth along with capital discipline of the company can give opportunity for the continuous growth. However, this is the present suitability of the current strategies.
According to the strategic development of the organisation and the current process it is suggested that they need to align the capital investment process with the core bard activities of the organisation. Moreover, the effective approaches can state about the development of the organic brand strategies to maintain the sustainability of the process. The leverage to consolidate comparative advantages and the private brand strategy process both can be considered as the focused area of the retail organisation. They have to research the current trends of the market and according to the trends they need to consider the refreshment of private strategies of brandings.
In the context of the customer relationship process, Super Retail must maintain the establishment of the personalized relationship process with the consideration of the capitalisation, customers and the effective insights of the company. The activities related to the deeper understanding of the customers which consider sophisticated insights and the analysis of the process. The effective developed structure of the customer relationship process must be considered here to drive the visitation and the growth of the transaction activities. However, the organisation is suggested for the effective alignment of the marketing activities with the consideration of the merchandising approach and the pricing strategies of the customers. The supply chain process of the organisation needs to be very much effective because the optimisation of the Australian and the New Zealand distribution process can consider the centre of networks, flows of products and the planning process. The effective activities of the customer online orders can give maximum benefits to the sourcing group of capabilities. The effective simplification of the business process is also essential in that context. Therefore, it can be easily stated that the accompanying need to remove the duplication and leverage approaches of scaling (Drake et al., 2019). Moreover, they have to make the mindset where they can easily align the activities related to the KPI and the value-based approach to serve better to the organisation. The effective modernisation of the technologies must be considered here by the organisation for better purpose.
Conclusion
According to the research over Super Retail Group it can be concluded that the organisation is generally considered a better position in the retail industry of Australia. The operation process of the organisation is generally based over the sports, outdoor activities and the leisure parameters in the market of Australia and New Zealand. However,this research process states about the financial ratios which are able to represent the present and past performance process of the organisation. Moreover, the peer analysis with the industry average is also considered here. The strategic suggestion section gives some effective suggestions related to the marketing, supply chain and the customer relationship process of the organisation.
Reference list
Amiluddin, Baso, A., Najamuddin and Hamzah 2020, "Financial feasibility analysis of skipjack tuna 0RW1S34RfeSDcfkexd09rT2(Katsuwonus pelamis)1RW1S34RfeSDcfkexd09rT2 catching in Bone bay, South Sulawesi, Indonesia", IOP Conference Series.Earth and Environmental Science, vol. 492, no. 1.
Andriana, Y., Indriati, A., Mayasti, N.K.I., Iwansyah, A.C., Anggara, C.E.W., Litaay, C. and Triyono, A. 2021, "Adlay 0RW1S34RfeSDcfkexd09rT2(Coix lacryma-jobi1RW1S34RfeSDcfkexd09rT2), a potential source alternative to wheat flour: A financial feasibility analysis for small scale production", IOP Conference Series.Earth and Environmental Science, vol. 672, no. 1.
Basyuni, M., Situmeang, S.M.T., Putri, L.A.P., Yusraini, E. and Lesmana, I. 2020, "Financial analysis of pidada syrup (0RW1S34RfeSDcfkexd09rT2Sonneratia caseolaris1RW1S34RfeSDcfkexd09rT2)", IOP Conference Series.Earth and Environmental Science, vol. 454, no. 1.
Campisi, D., Mancuso, P., Mastrodonato, S.L. and Morea, D. 2019, "Efficiency assessment of knowledge intensive business services industry in Italy: data envelopment analysis (DEA) and financial ratio analysis", Measuring Business Excellence, vol. 23, no. 4, pp. 484-495.
De Oliveira Santini, F., Wagner, J.L., Frederike Monika, B.M. and Mateus, C.P. 2019, "The antecedents and consequences of financial literacy: a meta-analysis", The International Journal of Bank Marketing, vol. 37, no. 6, pp. 1462-1479.
Drake, M.S., Quinn, P.J. and Thornock, J.R. 2017, "Who Uses Financial Statements? A Demographic Analysis of Financial Statement Downloads from EDGAR", Accounting Horizons, vol. 31, no. 3, pp. 55.
Fauzi, E., Calista, I., Hamdan, Putra, W.E., Mikasari, W., Ishak, A., Yuliasari, S. and Sastro, Y. 2021, "Financial analysis of RGL citrus (0RW1S34RfeSDcfkexd09rT2Citrus reticulata1RW1S34RfeSDcfkexd09rT2) farming in Rejang Lebong Regency Bengkulu", IOP Conference Series.Earth and Environmental Science, vol. 733, no. 1.
Fedorková, K. 2018, "Company Decline, Crisis Management, Financial Management, Financial Analysis", Marketing and Branding Research, vol. 5, no. 1, pp. 8-22.
superretailgroup.com.au , 2021, About financial ratios, Available at: https://www.superretailgroup.com.au/investors-and-media/reports-and-publications/ [Accessed on : 03.08.2021]
Appendix
|
Name of ratios |
2018 |
2019 |
2020 |
|
Valuation ratio |
|||
|
Enterprise value to EBITDA = (Earnings + Interest + Income tax + Depreciation)/ Amortization |
6.67 |
6.51 |
4.69 |
|
Enterprise value = (Market capitalisation + Stock preferred + debt outstanding + Minority interest – Cash equivalent and cash) |
1.29B |
1.25B |
1.55B |
|
Price to book ratio = Market price per share / book value per share |
2.06 |
1.99 |
1.80 |
|
Price to cash flow ratio = share price / Cash flow per share |
5.52 |
7.37 |
2.91 |
|
Price to sales ratio = market capitalisation / Annual sales |
0.63 |
0.60 |
0.57 |
|
Price to earnings ratio = Share price / Earnings per share |
12.46 |
11.66 |
14.60 |
|
Profitability ratio |
|||
|
Net margin % = Net profit / total revenue * 100 |
4.99 |
5.14 |
3.90 |
|
EBITDA margin % = (Earnings + Interest + Income tax + Depreciation)/ Amortization |
11.87 |
11.48 |
19.04 |
|
Operating margin % = Operating income/ revenue |
8.77 |
8.21 |
9.05 |
|
Gross margin % = (net sales-COGS)/ Net sales |
44.93 |
45.01 |
44.96 |
|
Return on invested capital % = [ EBIT* (1-tax rate)/ Invested capital] * 100 |
10.59 |
11.41 |
6.87 |
|
Return on equity % = Net income/ Shareholder’s equity |
16.54 |
17.24 |
12.19 |
|
Return on assets % = Net income/ total assets |
6.99 |
7.59 |
4.44 |
|
Liquidity ratio |
|||
|
Asset’s turnover = Net sales/ average total assets |
1.40 |
1.48 |
1.14 |
|
Inventory Turnover = Cost of goods sold/ average inventory |
2.59 |
2.70 |
2.93 |
|
Current ratio = Current assets/ current liabilities |
1.28 |
1.27 |
1.08 |
|
Quick ratio = Current assets – inventory / current liabilities |
0.10 |
0.10 |
0.41 |
|
Solvency ratios |
|||
|
Long term debt to total assets = Short term debt + long term debt + other fixed payments / Equity of shareholders |
0.24 |
0.21 |
0.32 |
|
Debt to assets ratio = total debt / total assets |
0.24 |
0.21 |
0.38 |
|
Debt to equity ratio = Short term debt + long term debt + other fixed payments / Equity of shareholders |
0.57 |
0.48 |
1.20 |


