Economics Assignment: Q&A Based on Economical Concepts
Question
Task
Write a detailed economics assignment answering the following questions:
Question 1
In 2017, Nepal’s production of rice and machinery was published by the Nepal Bureau of Statistics (NBS) as indicated by the table below:
Production in Nepal
|
Position |
P |
Q |
R |
S |
T |
U |
V |
W |
X |
Y |
Z |
|
Rice (1000 tons) |
0 |
10 |
26 |
37 |
45 |
50 |
55 |
59 |
66 |
77 |
80 |
|
Machinery (units) |
90 |
89 |
85 |
80 |
75 |
70 |
65 |
60 |
50 |
30 |
0 |
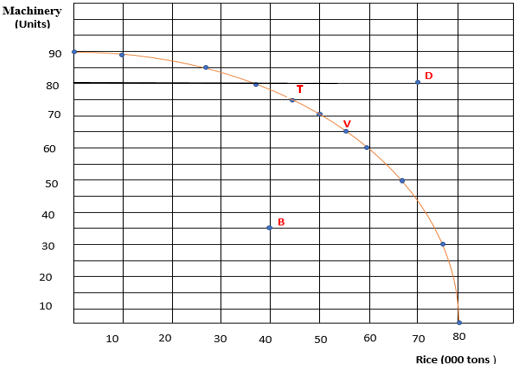
Based on the table above, a production possibility frontier (PPF) for Nepal can be plotted as below:

Use the NBS production table and production possibility frontier to answer the following questions:
A. Name positions B, V and D. Also, as indicated in the table, supposing Nepal is operating at level T, what is the opportunity cost of producing 10,000 more tons of rice?
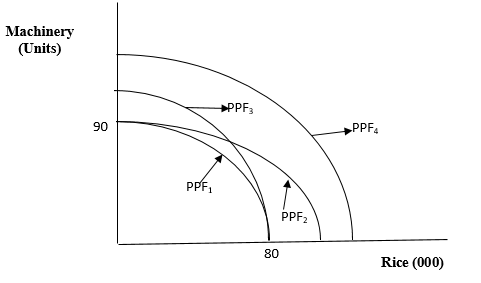
B. Use the graph below to answer the questions that follow:

B1: Suppose Nepal begins to manufacture fertilizers. Explain the impact of the discovery of fertilizers on Nepal’s economy using one of the PPF above.
B2: Also, supposing there is a discovery of steel in Nepal, explain the impact of steel on the economy of Nepal using one of the PPF above.
B3: Finally, the Minister of Finance in Nepal advices the World Bank that in order to increase rice production and machinery, each sector requires USD 50 billion, or a total of 100 billion. This 100 billion is made available by the World Bank. Explain the impact of these 100 billion budgetary allocations to the economy of Nepal. Use one of the PPF above.
Markets in Action: Demand and Supply
Question 2
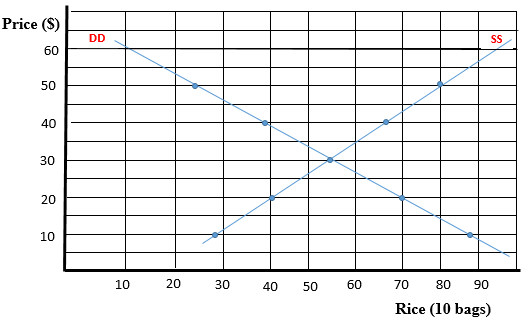
Suppose the graph below represents the demand and supply for rice at various prices, answer the questions that follow.

The graph above is represented in the table below. Please complete the table below identifying the shortage or surplus.
|
Price (10kg bag) |
Demand (10 kg bags) |
Supply (SS) (10 kg bags) |
Surplus (+) Shortage (-) |
|
10 |
89 |
29 |
|
|
20 |
70 |
40 |
|
|
30 |
55 |
55 |
|
|
40 |
39 |
67 |
|
|
50 |
25 |
80 |
|
|
60 |
11 |
95 |
A. Based on your findings in the table above, what is the market equilibrium price and quantity for rice?
B. Also, please examine the factors that can motivate the government to reduce the price of rice at $20 per 10 kg bag and the effects of that government legislation on the rice market.
Price Elasticity of demand and supply
Question 3
The price for cigarettes sold by Big Tobacco Co Ltd was6.00 per packet in March 2018. During the month of March, the consumption of cigarettes was 1000 packets. However, the Board of Directors of Big Tobacco Co Ltd decided to increase the price by 25% during the month of April. As a manager you noted that price elasticity of demand was 0.8. As a manager Big Tobacco Co Ltd:
A. Advise your management of the strategy that could be adopted by your firm to maintain sales.
B. Also, advise your government on recommended interventions in the cigarette market.
Production costs
Question 4
John was a high school teacher earning $ 80,000 per year. He quit his job to start his own business in pizza catering. In order to learn how to run the pizza catering business, John enrolled in a TAFE to acquire catering skills. John’s course was for 3 months. John had to pay $2,000 as tuition for the 3 months.
After the training, John withdrew $110,000 from his savings account. He had been earning 5 percent interest per year for this account. He also borrowed $50,000.00 from his friend whom he pays 6 percent interest per year. Further, to start the business John used his own premises. He was receiving $12,000from rent per year. Finally, to start the business John uses $50,000 he had been given by his father to go on holiday to USA.
John’s first year of business can be summarised as follows:
|
Item |
Amount $ |
|
Revenue- Pizza Section |
400,000 |
|
Revenue- Beverages Section |
190,000 |
|
2 Cashiers (wages per worker) |
55,000 |
|
Pizza ingredients |
50,000 |
|
Manager |
75,000 |
|
3 Pizza bakers (wages per baker) |
60,000 |
|
Equipment |
10,000 |
Based on your calculated accounting profit and economic profit, would you advise John to return to his teaching job? Show your work
Market Structure: Perfect Competition and Monopoly
Question 5

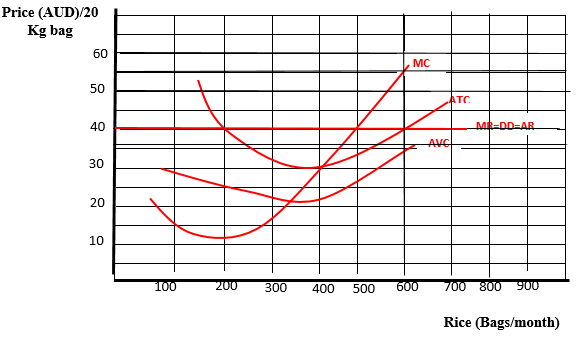
The above diagram illustrates the short run cost curves for Sarah Mat, a rice farmer in Queensland. Calculate the profit or loss for Sarah Mat and, examine the key characteristics for perfect competition firm with reference to Sarah’s farm.
Answer
Answer to question 1 of economics assignment:
A. In economics, the production possibility frontier represents a curve that illustrates the different amount of two products that a country can produce when both products depend on the limited resources. One of the properties of the production possibility frontier states that if the country increases production of one commodity then production of another commodity will decrease and vice versa. Considering the definition of the production possibility frontier, it can be said that point B has inefficient combination as Nepal cannot utilise all resources fully (Mert 2016). Thus, this point is addressed as an inefficient point. Point V represents efficient combinations of output that lies on the production possibility frontier. Therefore, this point is called efficient point. On the other side, point D represents an output combination which is not yet attainable. Therefore, this point can be called as impossible point of the economy.
The opportunity cost for producing extra tons of rice in production possibility frontier is expressed in terms of the unit of machinery given up. According to the given PPF table and figure, Nepal needs to give up 10units of machinery for producing 10000 tons of excess rice. Therefore, the opportunity cost is 10/10000 = 1/1000 units of machinery to produce an extra tone of rice.
B. B1:
Due to the discovery of fertilizers, Nepal’s economy will expand its rice production while the production of machinery will be unaltered (Kazmi2016). As a result, the PPF curve will shift leftward from PPF1 to PPF2.
B2: Due to the discovery of steels, Nepal’s economy will expand its machinery production while the production of rice will be unaltered. As a result, the PPF curve will shift leftward from PPF1 to PPF3.
B3: Due to the monetary assistance given by the World Bank, Nepal’s economy will expand both of its rice and machinery production. As a result, the PPF curve will shift leftward from PPF1 to PPF4.
Answer to question 2:
|
Price (10kg bag) |
Demand (10 kg bags) |
Supply (SS) (10 kg bags) |
Surplus (+) Shortage (-) |
|
10 |
89 |
29 |
- 60 |
|
20 |
70 |
40 |
- 30 |
|
30 |
55 |
55 |
0 |
|
40 |
39 |
67 |
28 |
|
50 |
25 |
80 |
55 |
|
60 |
11 |
95 |
84 |
A. The market equilibrium price and quantity for rice can be determined by considering the demand and supply curve. When demand and supply equate each other, the market gets its equilibrium price and output (Farzaneh, Doll and De Oliveira 2016). According to the table, demand for and supply of rice equates with each other at $ 30 of 10kg bag. Hence, this is the market equilibrium price and 55 kg bags are the equilibrium quantity for rice.
B. The government can set the price of rice at $ 20 per 10 kg bag for controlling price increase in the market. Without government intervention, the market can experience higher prices for rice due to hoarding that in turn can create artificial demand for the product in the market. Therefore, the government can protect black marketing through legally fixing the price at $ 20 per 10 kg bag.
Answer to question 3:
Own price elasticity implies the percentage change in demand for a product due to 1% change in its price. Here, demand elasticity for cigarettes is 0.8, which represents inelastic demand for it. Hence, it means 25% increase in price of the product cannot reduce the consumption by significant amount. As per the given situation,
The P1 or initial price is $ 6 per packet
Initial consumption is Q1= 1000 packets
New price is $ 7.5 per packet
Own price elasticity is 0.8
Thus, applying the point elasticity formula, one can the new consumption level of cigarettes.
0.8 = (Q2 – 1000)/ (7.5 – 6) x 6/1000
- 0.8 = (Q2 – 1000)/ (1.5) x 6/1000
- Q2 = 1000 – 200
- Q2 = 800
Thus, the new level of consumption of cigarette is 800 packets.
A. The manager will instruct the management to reduce excess production of the product as the company can make same amount of profit without producing 200 units of cigarette (Gostkowski 2018). Hence, it will be good for the company to produce less amount of cigarette.
B. The government can implement tax on tobacco for reducing its consumption. This is the main source of earning revenue of the government as tax cannot reduce the consumption of cigarette.
Answer to question 4:
According to Heitzman and Huang (2019), at the time of calculating accounting profit, Jhon should follow the basic formula, which is: Total revenue – Explicit costs
Hence, accounting cost of him is:
|
Item |
Amount $ |
Cost |
|
Total revenue |
(400,000 + 190,000) |
590000 |
|
Cost of training |
|
2000 |
|
Interest |
50000 * 6% |
3000 |
|
Cost of hiring 2 cashiers |
55000*2 |
110000 |
|
Ingredient cost |
|
50000 |
|
Cost for hiring a manager |
|
75000 |
|
Cost of hiring 3 pizza bakers |
60000*3 |
180000 |
|
Cost for Equipment |
|
10000 |
Hence, Accounting profit of John is $ 160000
For calculating economic profit, John will deduct both of his explicit and implicit costs from total revenue (Chatterjee et al. 2018). Thus, his economic profit will be:
|
Opportunity Cost |
Amount $ |
Cost |
|
Salary |
|
80000 |
|
Rent |
|
12000 |
|
Money withdrawn |
110000 |
|
|
Interest |
110000 * 5% |
5500 |
|
Travel cost |
|
50000 |
Therefore, economic profit of John is $ 12500
Hence, from these two outcomes it can be suggested that John can do his business as he can get higher economic profit in this context.
Answer to question 5:
The given diagram represents a short-run equilibrium condition, where the equilibrium occurs when marginal revenue equates with marginal cost. In the given diagram, this situation occurs when the farmer produces 500 bags of rice in each month. The corresponding revenue is 40 AUD/ 20 Kg bag and average cost is around 34 AUD/ 20 kg bag. Thus, the farmer is getting excess profit in the short-run where the average revenue is higher than average cost.
This diagram depicts a key characteristic of a perfect competition firm. This is, the firm can gain excess profit during short-run when its average revenue remains higher than average cost for producing a certain amount of output. However, this situation is the same in the long-run (Grimm et al. 2017). During this time, the average revenue and average cost becomes equal and hence the firm does not get any opportunity to gain excess profit, rather, it only gains normal profit.
References:
Chatterjee, S., Nag, R., Dey, N. and Ashour, A.S., 2018. Efficient Economic Profit Maximization: Genetic Algorithm based Approach. In Smart Trends in Systems, Security and Sustainability (pp. 307-318). Springer, Singapore.
Farzaneh, H., Doll, C.N. and De Oliveira, J.A.P., 2016. An integrated supply-demand model for the optimization of energy flow in the urban system. Journal of Cleaner Production, 114, pp.269-285.
Gostkowski, M., 2018. Elasticity of consumer demand: estimation using a quadratic almost ideal demand system. Econometrics, 22(1), pp.68-78.
Grimm, V., Schewe, L., Schmidt, M. and Zöttl, G., 2017. Uniqueness of market equilibrium on a network: A peak-load pricing approach. Economics assignment European Journal of Operational Research, 261(3), pp.971-983.
Heitzman, S. and Huang, M., 2019. Internal information quality and the sensitivity of investment to market prices and accounting profits. Contemporary Accounting Research.
Kazmi, R., Ghani, I., Mohamad, R., Tariq, M., Bajwa, I.S. and Jeong, S.R., 2016. Trade-off between automated and manual testing: a production possibility curve cost model. Int. J. Advance Soft Compu. Appl, 8(1), pp.12-27.
Mert, M., 2016. Measuring economic growth and its relation with production possibility frontier and returns to scale. International Journal of Economics and Research, 7(6), pp.75-86.


