Economics Assignment: Analysis Based On Microeconomics Concepts
Question
Task:
Complete the following economics assignment:
Question 1:
Describe some of the tradeoffs faced by each of the following:
- a family deciding whether to buy a house
- a principal of a high school deciding how much to spend on a new gymnasium
- a company president deciding whether to purchase a new machinery
- a student deciding on how much to study for a class
Question 2:
An Economy consists of three workers: Joey, Rachel, and Chandler. Each works for 8 hours per day and can produce two services: chair and tables.
In an hour, Joey can either produce one chair or two tables, Rachel can either produce one chair or one table, Chandler can either produce two chairs or one table.
- Calculate how much of each service is produced under each of the circumstances:
- All three send their time on producing only chairs. (A)
- All three spend all their time producing only tables. (B)
- All three spend half their time on each activity. (C)
- Rachel spends half their time on each activity, Joey washes only chairs and Chandler only produces tables. (D)
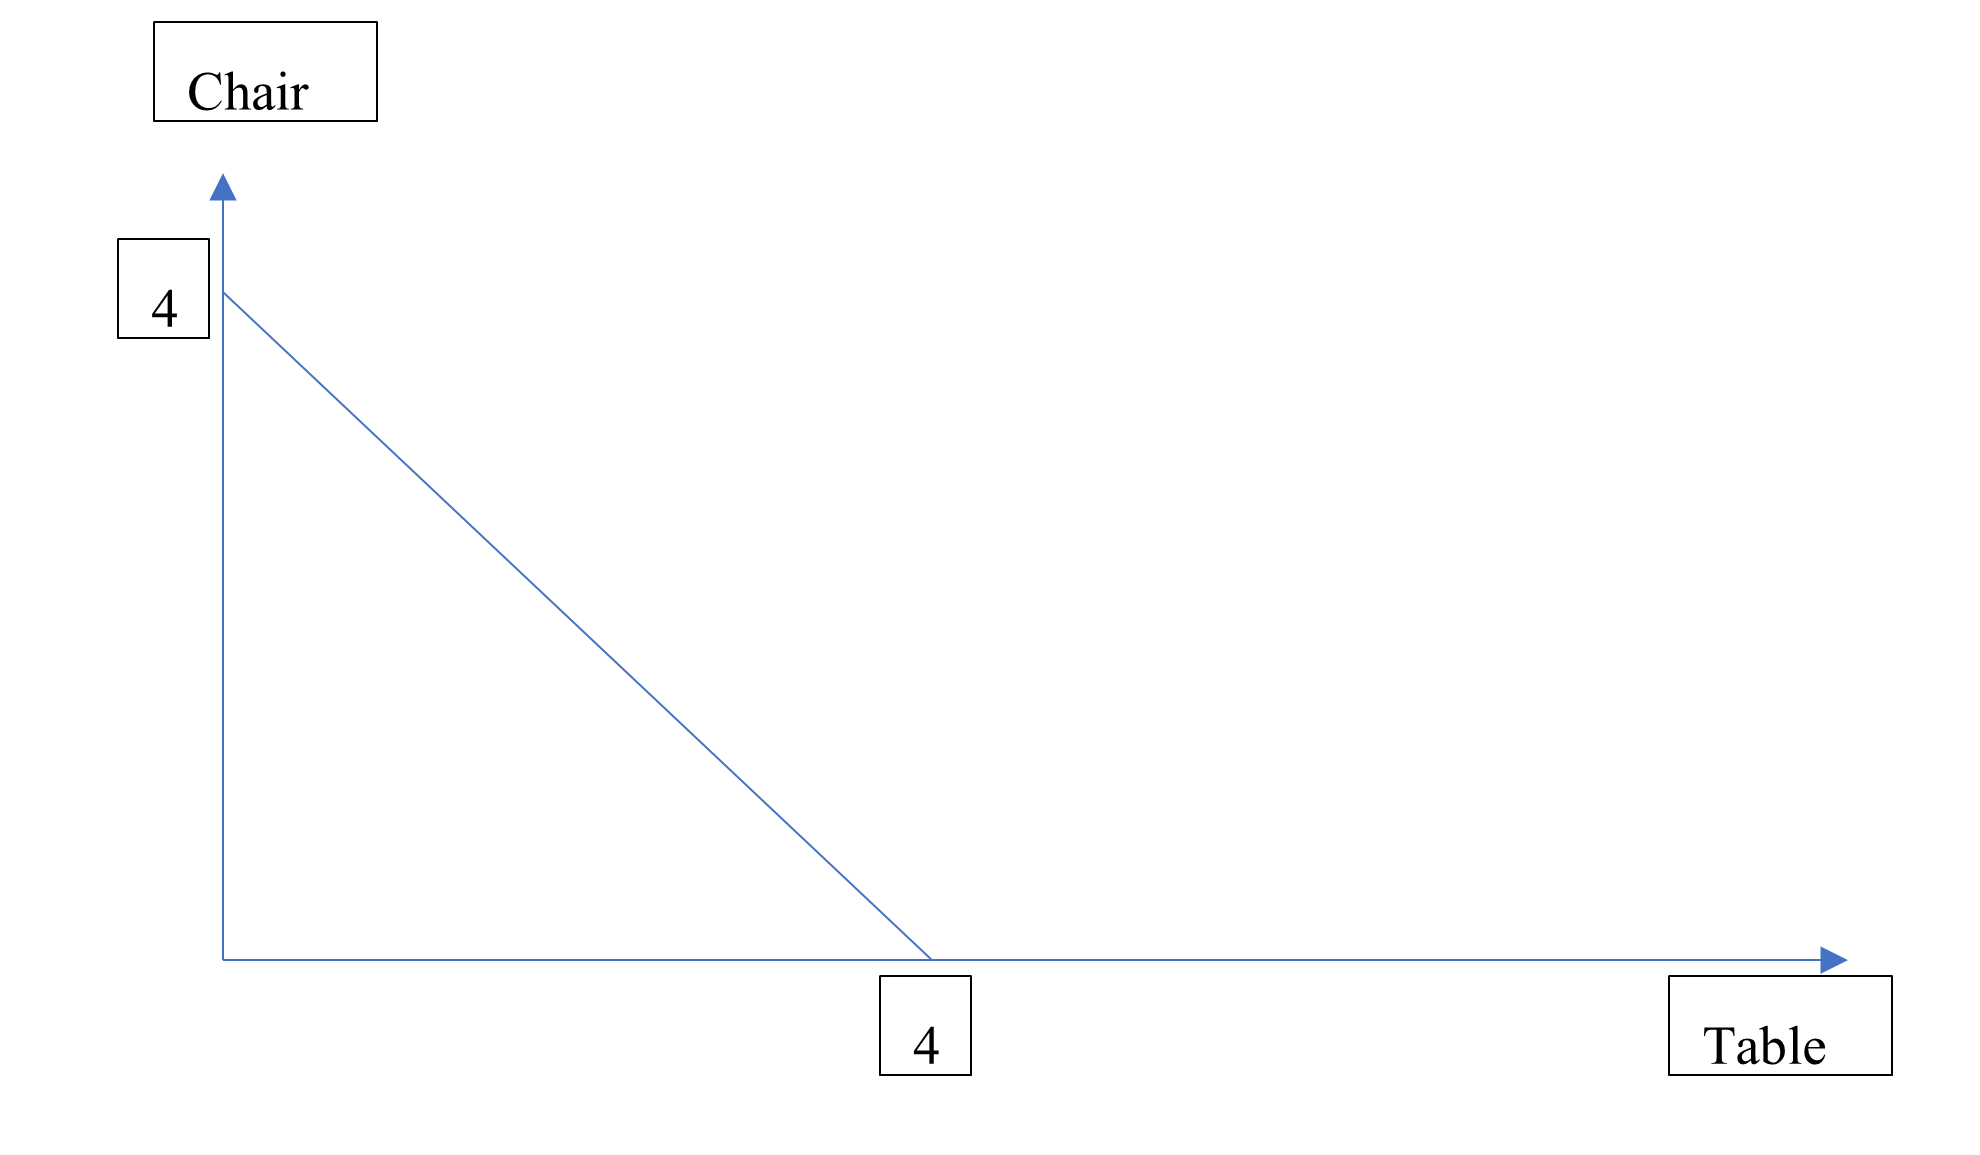
- Graph the production possibility frontier (PPF) for this economy. Using your answers to part (a), identify points A, B, C, D.
- Explain why the PPF has the shape it does.
- Are any of the allocations in part (a) inefficient? Explain.
Question 3:
The following table describes the production possibilities of two cities:

- Without trade, what is the price of blue sweaters (in terms of red sweaters) in Ottawa? What is the price in Toronto? Explain your answer.
- Which city has an absolute advantage in the production of each sweater? Explain.
- Which city has a comparative advantage in the production of each colour of sweater? Explain.
- If the cities trade with each other, which colour of sweater will each export? Explain.
- What is the range of prices at which trade can occur? Explain.
Question 4:
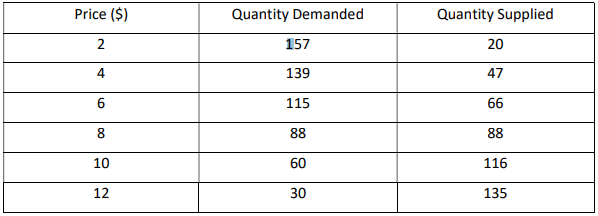
The market for ice-cream has the following demand and supply schedules:

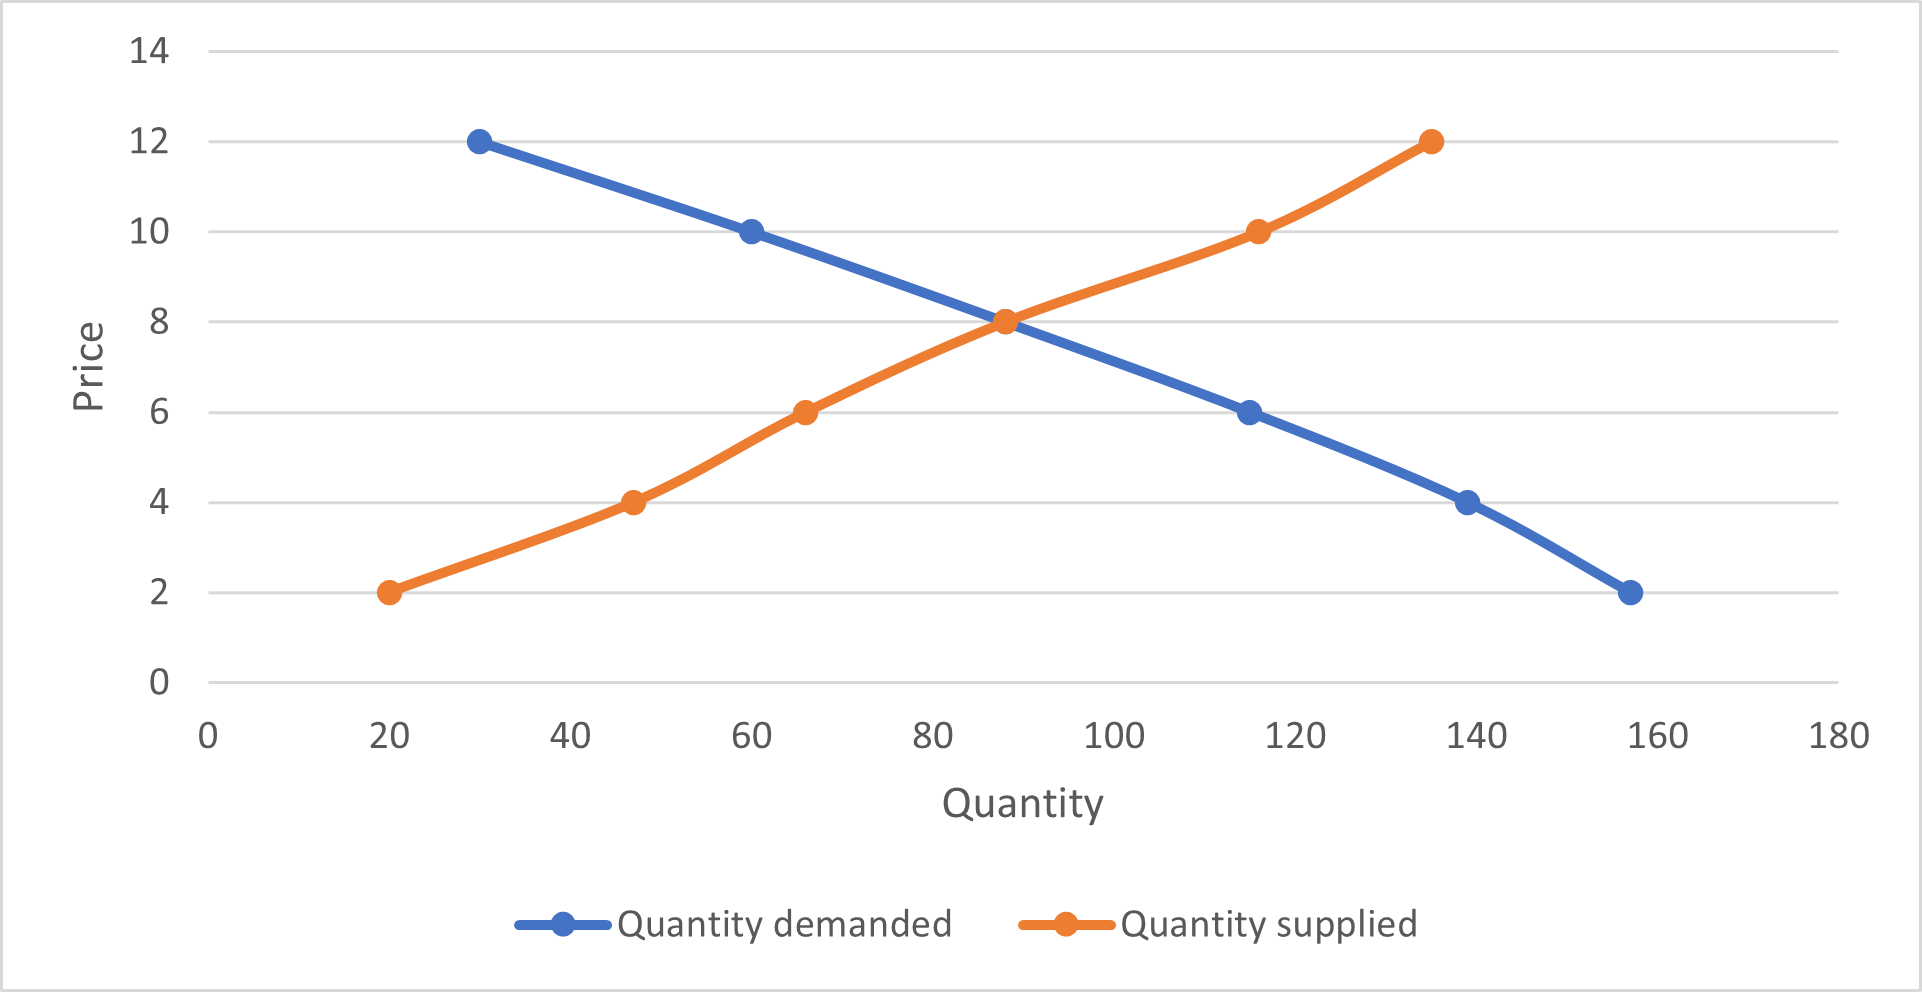
- Graph the demand and supply curves.
- What is the equilibrium supply and quantity in this market? Explain.
- If actual price in this market was above the equilibrium price, what would drive the market toward the equilibrium? Explain.
- If the actual price in this market is below the equilibrium price, what would drive the market toward the equilibrium? Explain.
Question 5: Suppose that business travellers and vacationers have the following demand for airline tickets from New York to Denver:

- As the price of tickets rises from $300 to $600, what is the price elasticity of demand for
- business travellers; and
- vacationers? (Use the midpoint method in your calculations.)
- What would be the likely impact on the elasticity of business travellers during the COVID-19 pandemic?
Question 6 (10 marks):
A recent study found that the demand and supply schedule for Frisbees are as follow:

- What are the equilibrium price and quantities of Frisbees? Explain.
- What will happen if the government imposes a price floor of $4 below the equilibrium price. What is the new market price? Explain. How many Frisbees are sold? Explain.
- What will happen if the government imposes a price ceiling of $3 above the equilibrium. What is the new market price? Explain. How many Frisbees are sold? Explain.
Answer
Answer to question 1:
a. Money spend in the purchasing new house can be utilised in food, clothing, vacation, education or different purposes. Hence, it is stated herein economics assignment that tradeoffs will take place with all the alternatives could have been done rather than purchasing the new house.
b. As per the given scenario, tradeoffs will take place in case of the better sports outcome for the student and lower budget of the school. If higher amount spending is done in gymnasium, it will result in better performance of students in sports at a cost of the lower available cash budget for the school in next financial year.
c. Here tradeoffs will take place with higher inventory and higher cash budget. If the presidents decide to purchase new machinery, it will increase inventory of the firm and increase the output; however, cash budget for the next financial year will be low.
d. In the given case tradeoffs take place in case of the higher marks and better carrier with poor marks and poor carrier. If the student studies higher amount of time in a given day, then he or she has to less time to do other tasks like play, watching movies. However, higher study will result in better future with higher marks.
Answer to question 2:
As per the given information,
|
Chair |
Table |
|
|
Joey |
1 |
2 |
|
Rachel |
1 |
1 |
|
Chandler |
2 |
1 |
a.
- If all produce chairs:
If everyone produces chair, then joey will produce 1 chair, Rachel will produce 1 chair and chandler will produce 2 chairs.
Hence, total chairs produced: 1 + 1 + 2 = 4
- If all produce tables:
If everyone produces tables, then joey will produce 2 table, Rachel will produce 1 table and chandler will produce 1 table.
Hence, total tables produced: 2 + 1 + 1 = 4
- If all produce each product:
In 1 hour, each will produce following number of chair and table
|
Chair |
Table |
|
|
Joey |
1/2 |
1 |
|
Rachel |
1/2 |
1/2 |
|
Chandler |
1 |
1/2 |
Thus, total number of chairs produced: ½ + ½ + 1 = 2
Total number of tables produced: 1 + ½ + ½ = 2
Production as per given scenario:
As per the given information, production of chair and table by individuals are as follows:
|
Chair |
Table |
|
|
Joey |
0 |
0 |
|
Rachel |
1/2 |
1/2 |
|
Chandler |
0 |
1 |
Thus, total number of chairs produced: ½
Total number of tables produced: 1 + ½ = 1 ½
b.

Figure 1: Production possibility frontier
c. Production possibility frontier (PPF) is the locus of all combination of all output of two goods. Any point on the PPF is efficient, whereas any production combination below or over the PPF demonstrates inefficient points (Almubidin 2019). As the production level at max is same with endowment of all the labour force is same, thus PPF is a straight line. Production of 4 tables or chairs is efficient and if it need to be reduced, then efficient point can be achieved through reduction in same ratio.
d. As per the figure 1, when Rachel spends half their time on each activity, Joey washes only chairs and Chandler only produces tables, then output combination is not efficient.
Answer to question 3:
Given production possibilities:
|
Red sweater per worker per hour |
Blue sweater per worker per hour |
|
|
Ottawa |
3 |
1 |
|
Toronto |
2 |
4 |
a. As per the given production possibility matrix,
Price of blue sweater in terms of the red sweater in Ottawa would be = 3/1 = 3
Thus, the price of 1 pair of blue sweaters is equal to 3 red sweaters.
Price of blue sweater in terms of the blue sweater in Toronto would be = 2/4 = .5
Thus, the price of 1 pair of blue sweaters is equal to .5 red sweaters.
b. With all the available resources, Ottawa can produce 3 red sweater per worker per hour and 1 blue sweater per worker per hour. On the other hand, Toronto, as per the production possibilities of two cities, can produce 2 red sweater and 4 blue sweater per worker per hour (Galles et al. 2019). Hence, Ottawa can produce higher number of red sweaters compared to Toronto and Toronto can produce higher number of blue sweaters compared to Ottawa with all available resource. Thus, Ottawa has absolute advantage in production of red sweater and Toronto has absolute advantage in production of blue sweater.
c. Considering the production possibilities of two cities, opportunity cost can be calculated as follows:
In Ottawa:
Opportunity cost of producing one red sweater = 1/3
Opportunity cost of producing one blue sweater = 3
In Toronto:
Opportunity cost of producing one red sweater = 4/2 = 2
Opportunity cost of producing one blue sweater = 2/4 = 1/2
Hence, Ottawa has low opportunity cost in production of red sweater and Toronto enjoys low opportunity cost in production of blue sweater.
Thus, Ottawa has comparative advantage in production of red sweater and Toronto has comparative advantage in producing blue sweater.
d. Each city under trade situation will export that product, in which it has comparative advantage. Thus, as Ottawa has comparative advantage in production of red sweater, Ottawa will export red sweater. On the other hand, Toronto has comparative advantage in producing blue sweater, thus it will export blue sweaters (Dean et al. 2020).
e. representing the price of blue sweater in terms of red sweater, it is found that 1 pair of blue sweaters is equal to 3 red sweaters in Ottawa and 1 pair of blue sweaters is equal to .5 red sweaters in Toronto. Hence, the trade of blue sweaters takes place, when price ranges between .5 and 3. Similarly, price of red sweater in terms of blue sweater, 1 pair of red sweaters is equal to 1/3 pair of blue sweaters in Ottawa and 1 paid of red sweater is equal to ½ pair of blue sweaters in Toronto. Thus, trade will take place if price ranges between 1/3 to ½.
Answer to question 4:
a.

Figure 2: Demand and supply curves
b. As per the figure 1, it can be seen that demand and supply equates at such place where the quantity demanded is 88 unit of ice cream and quantity supply is 88 unit of ice cream. Hence, market equilibrium takes place at 88 unit of ice cream.
c. At equilibrium situation, market price is 8$. Now if the market price is above equilibrium price, then demand will fall and provide a downward pressure on the quantity demand curve. With the fall in demand, there will be rise in difference between quantity supply and demand resulting higher excess supply. Through the reducing demand, by market mechanism, demand and supply will equate at market equilibrium again.
d. At equilibrium situation, market price is 8$. Now if the market price is below equilibrium price, then demand will rise and provide an upward pressure on the quantity demand curve. With the rise in demand and fall in supply at lower price, there will be rise in difference between quantity supply and demand resulting higher excess demand. Through the increasing demand at lower price, by market mechanism, demand and supply will equate at market equilibrium again.
Answer to question 5:
a. Midpoint method of elasticity: Percentage change in quantity / Percentage change in price
Percentage change in quantity = Q2-Q1Q2+Q12 * 100
Percentage change in price = P2-P1P2+P12 * 100
i. As per the given demand matrix, if price change from $300 to $600, then change in quantity demand for business travellers will be 2400 to 1780.
Hence, Percentage change in quantity = 1780-24002400+17802 * 100 = (-620/2090) * 100 = -29.66%
Percentage change in price = 600-300600+3002 * 100 = (300/450) * 100 = 66.66%
Using midpoint elasticity method, elasticity = -29.66/66.66 = 0.44
Thus, considering absolute value, elasticity of demand for business travellers is 0.44
ii. As per the given demand matrix, if price change from $300 to $600, then change in quantity demand for vacationer will be 1800 to 800.
Hence, Percentage change in quantity = 800-1800800+18002 * 100 = (-800/2600) * 100 = -30.76%
Percentage change in price = 600-300600+3002 * 100 = (300/450) * 100 = 66.66%
Thus, using midpoint elasticity method, elasticity = -30.76/66.66 = -0.46
Thus, considering absolute value, elasticity of demand for vacationer is 0.46
b. Due pandemic, economies around the world has faced month long lockdown and halting of businesses. As there has been fall in business and stringent protection law from spreading corona virus was taken by the different governments, mode of international transportations has been halted (Jawad et al. 2018). Thus, the number of the business travellers has fell during last one year to a great extent. Now, as the elasticity of the business travellers is lower than 1 but higher than 0, hence it can be considered as the necessary service. So, though there has been pandemic and lack in mode of available transportations, yet business travellers will not face significant fall in demand of travel.
Answer to question 6:
a. Market equilibrium takes place, where the demand and supply equate. As per the given demand and supply schedule, it can be seen that quantity demand and supply equated at 8 unit of frisbees where the price is $18 per unit. Hence, the market equilibrium quantity is 8 unit of frisbees, whereas, equilibrium price is $18.
b. Price flooring is such an event where government control the market price and decides the minimum price that sellers can charge.
With the price floor, below $4 of market price, new equilibrium price will be: $18 - $4 = $14
Market equilibrium:
P-P1 Q-Q1 = Q2-Q1 P2-P1
P-16Q-3 = 17-16 5-3 = ½
2p -32 = q-3
Q = 2p - 29
Now, as the price is $14, quantity demand will be: Q = 2*14 – 29 = -1
Hence, at the new equilibrium price there will be no sales of the frisbees.
c. Price ceiling is a government tool with which government control the market price and limits the maximum price that sellers can charge.
With the price ceiling, above $2 of market price, new equilibrium price will be: $18 + $3 = $21
As per the given demand and supply schedule, at $21, sales of the frisbees will be 3.
Reference:
Almubidin, S., 2019. Production Possibility Frontier & its Relation to Other Costs. International Journal of Tax Economics and Management. https://journals.seagullpublications.com/ijtem/archive/f_IJ0320190722.pdf
Dean, E., Elardo, J., Green, M., Wilson, B. and Berger, S., 2020. What Happens When a Country Has an Absolute Advantage in All Goods. Principles of Economics: Scarcity and Social Provisioning (2nd Ed.). https://openoregon.pressbooks.pub/socialprovisioning2/chapter/26-2-what-happens-when-a-country-has-an-absolute-advantage-in-all-goods/
Galles, G.M., Graves, P.E. and Sexton, R.L., 2019. Leisure and the Production Possibility Frontier: A Two-Step Pedagogy. Economics assignment The American Economist, 64(1), pp.123-130. https://journals.sagepub.com/doi/full/10.1177/0569434518810425
Jawad, M., Lee, J.T., Glantz, S. and Millett, C., 2018. Price elasticity of demand of non-cigarette tobacco products: a systematic review and meta-analysis. Tobacco control, 27(6), pp.689-695. https://www.ncbi.nlm.nih.gov/pmc/articles/pmc6056338/


