Business Economics Assignment Exploring the Concept of Demand & Supply and Economic Theories
Question
TASK 1-
Demand and Supply analysis are fundamental to any business thus every business must understand its impact and dynamics. Demand and Supply analysis therefore underlines to some extent the growth and success of most businesses in our society today.
Critically analysed the following micro economics concepts with reference to any business of your choice.
1.1 Explain the law of Demand, movement along the same demand curve (with the aid of diagram) and changes in demand curve (with the aid of diagram).
1.2 Explain the law of Supply, movement along the same supply curve (with the aid of diagram) and changes in supply curve (with the aid of diagram).
TASK 2 –
1.1 Compare and contrast emerging theories and models in 21st century contemporary economics with those of the 20th century, and relate both of these to modern business practices.
Answer
Background Information of Business Economics Assignment
Business economics is considered as the study of the financial and economical state of nature of a country and more specifically the world. This field of applied economics is related to the current market trends where the comparison with past and future has to be made by interpreting the issues made by different ranges of corporations and industries. Business economics encompasses certain factors which impact the corporation activities included in the business organization, management, and expansion that are used to make with model and theories of economics. In this paper, business economics has been considered to be made for broader analysis where the concept of demand, supply, and their movement shifts with the change in market condition or with the change in people’s taste and preferences. Along with the consideration of demand and supply, some theories and models have been considered where the comparison has been made between the 20th century and 21st century with respect to modern theories and their application in business economics.
Task 1-Discuss the law of demand
As per the viewpoint of Cerreia-Vioglio et al., (2021, p. 5), demand is one of the most substantial economic principles that refers to the consumer’s wish for purchasing any kind of goods and services in the exchange of money or any specific goods or services. Considering this concept of demand mechanism law of demand can be easy to determine where the relationship between the price paid by the purchaser at the time of purchasing any goods and services and the quantity that is considered to supply by the supplier is negative or indirect. If the other business market factors are remaining at the same position, then the increasing price paid by the customers for purchasing their desired level of goods implies the decreasing quantity for that particular goods and services.
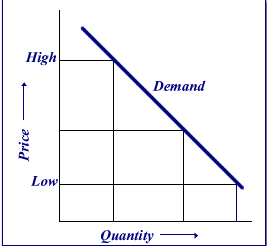
Figure 1: Law of demand
Source: (Chu et al., 2017, p. 722)
In the diagram, it has been observed that the demand curve is a downward-sloping straight line which shows the inverse relationship between price and quantity purchased. Here when the price increases the quantity for their particular produce demanded by customers would decrease and the opposite happens when the price decreases.
Show the movement along the demand curve
Movement along the demand curve takes place when both the price of the particular goods and services and the corresponding quantity demanded both changes with the change in time or market situation. The movement is considered when the ideal point shifts from one point to another point through the same downward sloping demand curve. As per the consideration made by Reinert, (2020), other things remain unchanged when the change in quantity demanded takes place or a change in price takes place. The movement along the demand curve can be more specific when we take examples of the current market scenario by considering an organization and its products and services. Here British petroleum has been taken as an example to understand the movement along the demand curve. The movement along the demand curve was observed when the price of petroleum increased by 7.43 per liter and reached 136.93 p per liter the people start consuming less quantity of petrol as they find it better to reduce their consumption of petrol (Forbes.com. 2021). Here the movement along the demand curve is observed and shown in the following graphical representation.
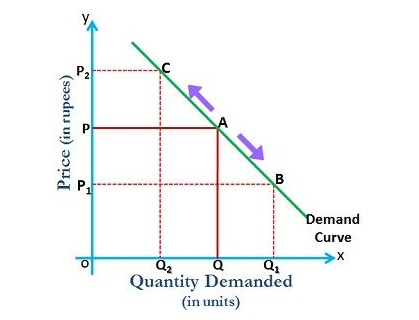
Figure 2: Movement along the demand curve
Source: (Investopedia. 2021)
In the above diagram, it has been observed that the ideal position of the petroleum market for British petroleum (BP) is when it stays at A. however the price of petrol increased by 7.43p per litre which is denoted by P2, and then the quantity reduced to Q2. The opposite thing happens if the price of petrol will decrease in the near future when people start consuming more petrol from the company due to their increasing consumption of petroleum.
Show the changes in the demand curve
In terms of business economics, there is a difference between movement along the demand curve and shift of demand curve as these two phenomena are used to state two different concepts. Where on the one hand movement denotes a change in position of the ideal situation along the identical demand curve where the shift of demand curve implies a new demand curve position has been observed from the older demand curve position. More specifically a shift of demand curve has been observed when the determinants of demand for the particular product or services other than price have been changed. Holding the price at a constant state there are various factors like change in taste and preferences, change in the population of the countrywide, change in income, and change in the price of complementary or substitute goods along with the change in expectations for future references. These factors cause the shift of the demand curve by directly affecting the quality demanded where the price of the product remains the same.
The shift of demand curve for British petroleum (BP) takes place where people start shifting more towards the use of electronic cars where there is no use of fuel with which they can contribute to the pollution free environment and also save the cost of fuel to a larger extent. This change in taste and preference shifts the demand curve to a newer position.
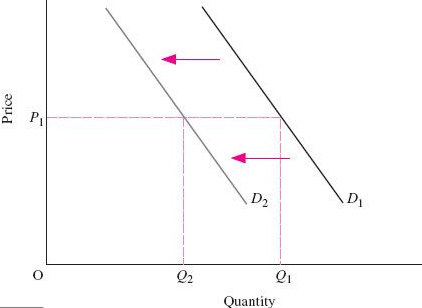
Figure 3: Shift of demand curve to leftward/downward
Source: (Wang, 2018)
In the above graph, a downward or leftward shift of demand curve has been shown which happened when people start consuming less petrol from British petroleum due to their change in preference for fuel expense and environment. Here considering this state, it has been observed that among 115706 registered cars in the United Kingdom in the year 2021, among which 18.18% that is 21726 are purely electronic (Autocar. 2021). This shows the shift of people towards eco-friendly transportation in upcoming years.
Discuss the law of supply
As per the discussion made by Investopedia, (2021), supply is considered as one of the fundamental concepts of business economics that determine the total amount of product or services available to the customers with the price at which the supplier made the supply of the product. This relationship of price and the quantity supplied is positive and directly related which is known as the law of supply. With the increasing price, the supply made by the supplier also tends to rise and this also increases the profit made by the producers for the particular product or services. The concept of the law of supply can also be understood with the basis of modern business economics where each product and service would have its own supply patterns as like the patterns of demand based on a particular price, utility, and preferences. The law of supply and more specifically the positive and direct relationship between the price and the quantity supplied can be better be explained with the help of the following graphical representation where the equilibrium position can also be defined at the point when a certain price the demand made by the purchaser and the supply made by the producer meet each other and the demand and supply curve intersects.
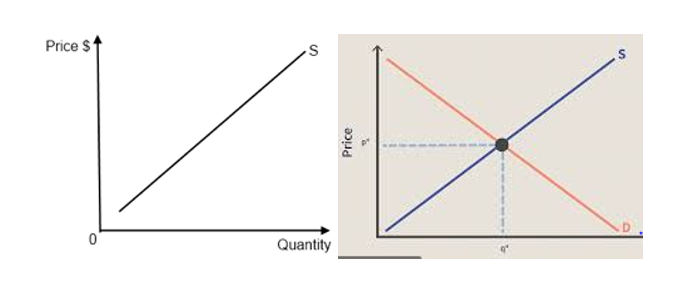
Figure 4: Law of supply and equilibrium
Source: (Demand, Supply, and Equilibrium, 2021)
In the first diagram, it has been observed that by considering price in the vertical direction and quantity in the horizontal direction supply curve is drawn as an upward rising straight line which shows the direct relationship between price and the quantity supplied. In the next diagram, the intersection of the downward sloping demand curve and upward sloping supply curve shows the equilibrium point where the demand and supply become equal at a specific business market state.
Show the movement along the supply curve
As per the consideration of Investopedia, (2021.), movement along the supply curve implies the variation in the quantity which is supplied by the producer at the change in market price where other determinants remain fixed at the earlier state.
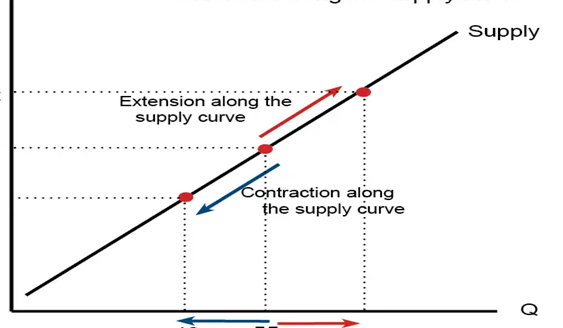
Figure 5: Movement along the supply curve
Source: (Becker et al., 2017)
With the help of the above diagram, the movement along the supply curve can be obtained. With the change in price the quantity supplied has been changed proportionality and due to this reason with the increase in price the expansion along the supply curve has been obtained and with the decrease in price the contraction of the supply curve has been observed. Considering the organization British petroleum when the company observed that the world’s petroleum price is increasing then the company tends to increase their quantity of supplies to get more profit.
Show the changes in the supply curve
Changes in the supply curve can be determined with the shift of the supply curve from one position to another and in this case, the supply curve changes are distinctive from the movement along the supply curve. There are various facts that cause the shift of supply curve and that are the price of input or raw materials with which the final good is considered to produce, the change in natural conditions, and the change in technology with advancement and innovation, imposition or exposition of government regulation or taxation on the goods or services. Here the supply curve can shift both in an upward and downward direction as per the change in any of these factors. The price of petroleum is assumed to be fixed at a certain level when the company observes that the price of inputs to manufacture petroleum or other fuel are tend to reduce then they produce more petroleum and increase the quantity of sell they used to sell before.
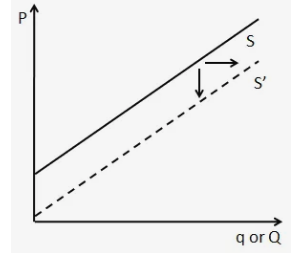
Figure 6: Shift of supply curve
Source: (Wang, 2018)
The rightward shift of the supply curve shows the increasing quantity at the same price when the price of inputs tends to reduce to an expected level.
ask2 -Compare and contrast emerging theories and models in 21st century contemporary economics with those of the 20th century, and relate both of these to modern business practices.
Theories of 20th century
Keynesian theory of economics:
Keynesian theory of economics was introduced in the 1930s in the period of the great depression whereas per this theory, total spending made in the business economy has a considerable impact on employment, inflation, and the level of output (Timlin, 2019). John Maynard Keynes first introduced this theory where the demand side of the economy focuses on the change in the economy over the short run. The study of economic behaviour and the market based on individual incentives are considered under this theory based on the broad national economic aggregate variables. Considering the situation of depression where people have no job and their money is coming to an end and Keynes stated that if the government-induced to increase their total spending for developing country’s economic state and also reduce the excessive burden of tax on people then there is a chance to escape from the depression. More spending includes more industrial revolutions for which the needs of employment will also be increased and people get benefited with job income of the overall country increases and that lifts up the economic position. The aggregate demand tends to increase with the increasing expenditure of the government where the rate of taxation tends to reduce up to a certain level. Aggregate demand can also be considered as the total demand for all kinds of goods and services that are used for the purpose of economic position and their compound stocking approaches come into action to handle the demand mechanism. The concept of demand in business dynamics and the concept of the law of demand can easily be defined with the help of a diagram. In the case of Keynes theory, the unemployment and inflation are the key points and that has been considered as important areas of economic development.
Classical and neoclassical theory:
Classical and neoclassical theories are introduced for the purpose of stimulating and enabling the business to reach the point of equilibrium (Vlados, 2019). Classical theory has been invented in the 20th century that implies the way where large-scale business instruments are measured to increase business and capability at the same time. Neoclassical theory is another theory that is based on commercial, manufacturing, and numerous expanses of finances and business economics. Here the industries set their objective for accomplishing their market position by contributing more to the country’s total gross domestic product where the revenue is considered to be made for ultimate revolutionary success factor. Laissez-faire policy is another idea that is concerned under this theory and model where the free entry and free exit into a country’s trade with the free market equilibrium without government intervention are found to be made for the stronger market base and business promotion.
Theories of 21st century
A behavioural theory of economics:
The behavioural economic model and nudge theory are considered as the 21st-century contemporary theory of economics which help to make the comparison and contrast among the traditional Economic approaches. As per the analysis of Thaler, (2017, p. 1799), the behavioural theory of economics combines the different elements of economics with the factors of psychology and made an analysis of individual Behaviour towards the various decisions and preferences. Human Behaviour is the important part in their decisions making at the time of purchasing any kinds of goods and services. This theory helps to understand people's day-to-day preferences and results in progressive understanding.
Nudge theory of economics:
Nudge theory is another Economic theory that defines the concept of individual behaviours (All you wanted to know about... Nudge Theory, 2021). In the theory of economics, the positive enforcement as the way to influence the people's decisions making and behaviours. Under this theory, people are encouraged to go towards their choice of making decisions in order to purchase any goods or services. Here human happiness and satisfaction are prioritized and which makes an impact on the governmental decision for setting up their price level and other nudge units in the country. In this theory, Richard Thaler assumes humans as not so rational creatures and they need motivation and intervention up to a certain extent where they find their best. When the individual finds no need for encouragement or intervention from other individuals or the government they are allowed to make decisions in order to purchase on their own.
Compare and contrast among the theories
There is a comparison between the behavioural theory and the theory of neoclassical which make the assumptions of most people are well defined and their preferences are well informed based on their interest and preferences. Irrespective of a Keynesian theory which is based only on the perspective of depression, nudge theory is more concerned with human behaviour and willingness to live with the efficient amount of products at the price at which they are comfortable. When in Keynesian theory Keynes considered the necessity of government intervention up to a higher extent where they increase their spending for the country's economic betterment on the other side nudge theory does not entertain the government intervention to a higher extent. After making the comparison between the nudge theory and the theories of 20th century, it can be stated that the nudge theory is important for evaluating the consumer behaviour.
Conclusion
At the end of the paper, it can be concluded that business Economics is based on the different perspectives of demand and supply mechanisms where some of the theories and models are considered to understand the basics of economics. In the first task, the concepts of demand and supply have been discussed with the movement of demand and supply curve. British petroleum has been chosen as an example to understand the change in demand-supply mechanisms. In the second task, the 20th and 21st-century theories and models have been discussed with their comparisons to understand different market prospects with the change in time.
Reference
Cerreia-Vioglio, S., Maccheroni, F., Marinacci, M. and Rustichini, A., 2021. Law of demand and stochastic choice. Theory and Decision, pp.1-17.
Reinert, K.A., 2020. An introduction to international economics. Cambridge University Press.
Forbes.com. 2021. [online] Available at:
Investopedia. 2021. Understanding the Law of Supply and Demand. [online] Available at:
Wang, Y., 2018. A Profit-Based Theory of Economic Growth and Upward Shift of Labor Supply Curve Implied by Phillips Curve. SSRN Electronic Journal,
Autocar. 2021. Best-selling cars in the UK | Autocar. [online] Available at:
Becker, G.S., Michael, G. and Michael, R.T., 2017. Economic theory. Routledge.
Timlin, M.F., 2019. Keynesian economics. Business economics assignment University of Toronto Press.
Vlados, C., 2019. The Classical and Neoclassical theoretical traditions and the evolutionary study of the dynamics of globalization.
Thaler, R.H., 2017. Behavioral economics. Journal of Political Economy, 125(6), pp.1799-1805.
@businessline. 2021. All you wanted to know about... Nudge Theory. [online] Available at:
Chu, C.N., Huang, T.Y. and Liu, S.S., 2017, May. Hedonic Pricing Method, the Third Law of Demand, and Marketing Strategy: An Abstract. In Academy of Marketing Science Annual Conference (pp. 721-722). Springer, Cham.
publisher], [., 2021. 3.3 Demand, Supply, and Equilibrium. [online] Open.lib.umn.edu. Available at:


