Business Analytics Assignment: Case Analysis of Insight Toy Corporation
Question
Task:
Business Case:
Insight Toys Corporation (‘Insight’) is one of the world’s largest toy makers with manufacturing and marketing operations across the globe. Insight’s founder and CEO passionately believe in transparency and making data-driven decisions.
You were recruited from a consultancy background to create a dedicated data analytics function within Insight’s corporate HQ to develop the company’s business intelligence, operational and strategic reporting tools.
As Head of Business Analytics, you and your team are required to roll out a structured consultancy approach to business analytics which leverages the company’s various internal datasets and relevant market intelligence.
In this project you are tasked with developing a Strategic Planning Report used by Insight’s executive team for its annual global planning retreat. This event is a key part of Insight’s corporate culture and ethos of ‘Agility, Accountability and Responsiveness’.
Managers and team members from across the global business are encouraged to bring their best ideas to the retreat for consideration by their colleagues and to openly critique their relative performance strengths.
At the retreat’s conclusion, the CEO wants to see a clear statement of priorities which will drive Insight’s future success and has a low tolerance for buzz words such as ‘business transformation’ and ‘digital marketing strategy’.
In developing this Report you need to examine the past performance trends and deliver decision-relevant insights across each functional unit of the company: Corporate services (Accounting, Finance and Legal), Operations and Supply Chain, Sales & Marketing, Customer Care and Product Development. The Strategic Planning Report is an important communication tool used in managerial decision-making and is targeted to a varied audience including: accountants, finance professionals, marketers, salespeople, product managers, and supply chain specialists. Therefore, the relevance, utility and timeliness of information presented are all critical for effective and efficient decision-making. The Report should incorporate details of the Business Analytics processes, datasets and analytical tools used, and any limitations involved.
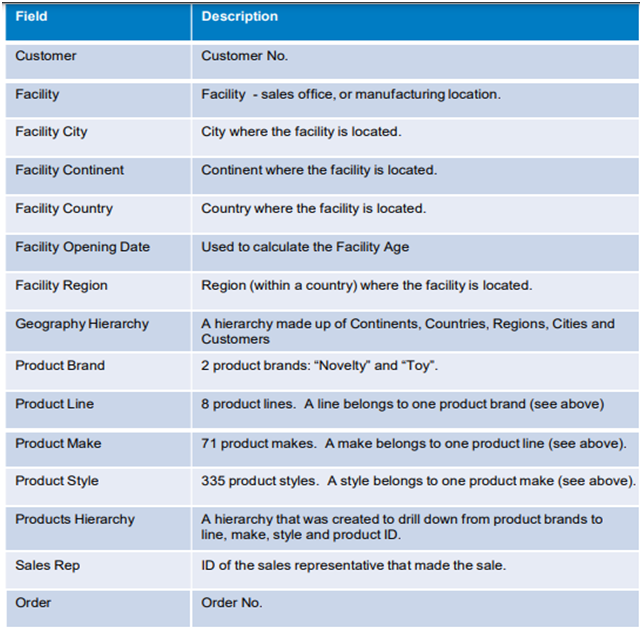
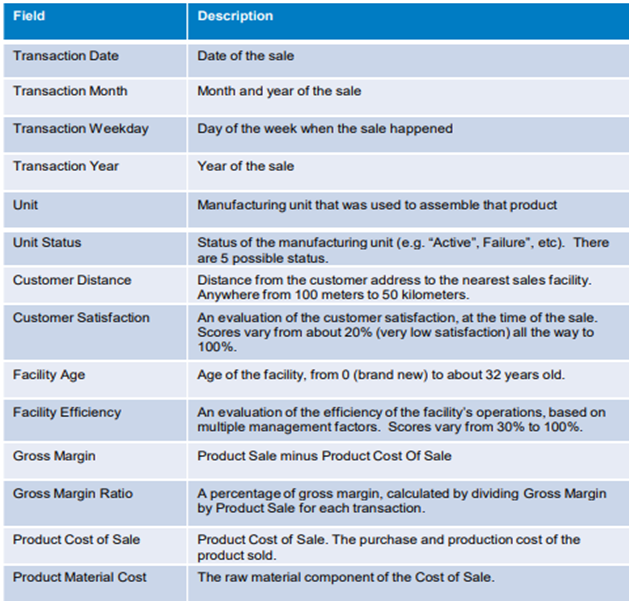
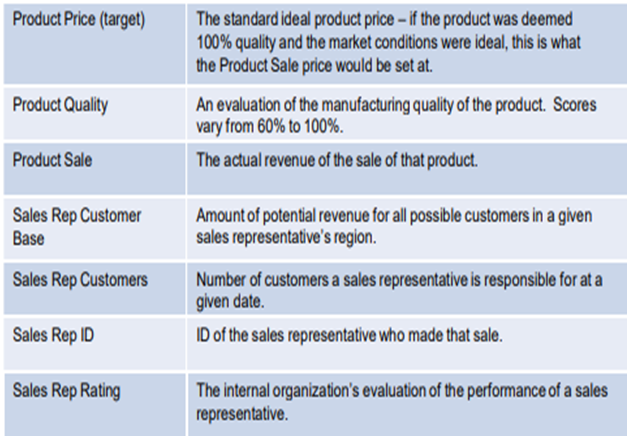
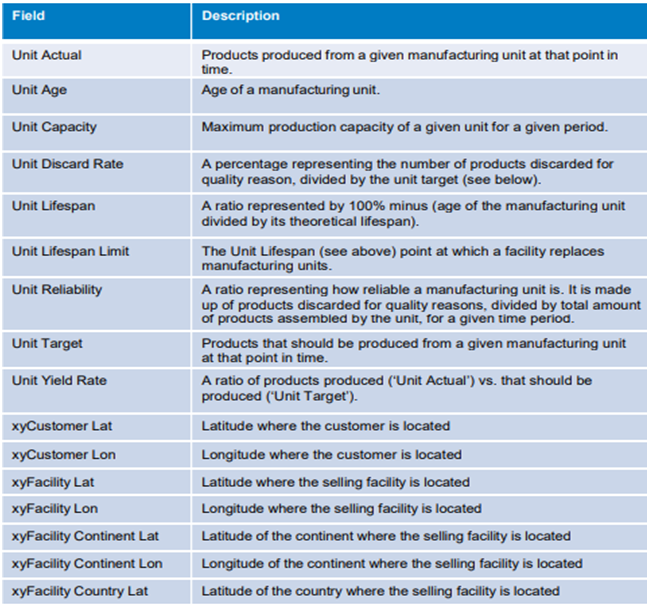

Your business analytics assignment task is to prepare a business report for the above case.
Answer
Executive Summary
Business analytics finds application in all field of business now a days. Business analytics helps business to understand, forecast and plan accordingly for the future success of the business. Insight Toy Corporation (‘insight’), undertaken in the business analytics assignment, is a world largest manufacturer and marketer of the toys. Insight aims to use the business intelligence, operational and strategic planning tools in its business. Insight has a dedicated data analytics operation team to work on all such business analytics activities and the company believes in having better business analytics can help in achieving better success in the business.
As per Insight requirements, a Strategic Planning Report is aimed to build as part of business analytics. The data is provided with global information of sales, orders, customer, manufacturing, sales representative data. The data is analysed on SAS Visual analytics tool with help of reports built from the different perspective of the company operations. The data is studied to find the different measures and parameters to build the reports. The reports are built understand the trend of the business based on the data provided. The trend of business sale over the years, product quality, product sales, unit manufactures, the facilities efficiency, the sale across the world made by the Insight company, correlation of the different sale criteria for the items such as product quality, facility efficiency, product cost are studied. The trend study and correlation study can help in understanding the raise and fall of the business operation against different parameters in the business. The reports are analysed to make interpretation easier and reliable as per the data.
Different forms of reports are generated based on cluster analysis, time series and trend analysis, cohort analysis, linear regression, and decision tree methodologies. The different report styles are developed such as bar chart, comparative time series chart, map charts, correlation report, trees etc. The report details and findings of the report are highlight for the Strategic planning report to engageeffectivecommunication in better decision-making process across different business units in the companyincluding accountants, finance professionals, marketers, salespeople, product managers, and supply chain specialists.
Introduction
Now a days companies over the world are trying to use the business intelligence as a tool to enhance their business operations and function for better future. Business intelligencetool is majorly used to have a better decision-making among the top management team of the company. Data forms the base for the business intelligence tools to make informed decisions. Business intelligence highly studies the data and detects the trend, correlation and helps in forecasting the data for the business to make decisions.
Insight Toys Corporation (‘Insight’) toy maker company having global presence finds the importance of the business intelligence tools and involves a separate team to study on the business data and provide valid insights and findings for the data to help the business to make better decisions on aiming towards the success of the business in future. It wants to understand the performanceof the business and know what the areas are to be provided focus so that the business can reach heights. The reequipment of the company is to cover the business intelligence study on all the functioning units of the business to understand the business from different business unit perspectives The strategic planning report is built with understanding the research problem, followed by discussing the methodology to be used and data analysis techniques. The reports and its interpretations are list with the findings made on the report which can help the business to make decisions. Finally set of recommendations are provided for the business based on the finding of the report data.
1. Research Problem
Insight Toys Corporation (‘Insight’) is a world famous and largest toy maker across the globe with manufacturing and marketing operations. The company’s founder and CEO depends on the making data driven decisions to help the business operations. The company highly uses the data to make decision of its functioning. The Insight’sheadquarters are planning to use business intelligence, operational and strategic reporting tools to work on better decision making. The company has data required for the data driven decision making processes collected internally and externally from different resources. Insight aims to build a strategic planning report from its data to find the priorities for the business to drive the Insight’s to success in future and to openly critique the performance strengths of the company.
The company wants to use the data to build the report for strategic planning for future success. The report should be able to analyse the past performance trends and interpret the information which can help drive the business to future success. The company requires a report for decision-relevant insight on the different function units such as Corporate services (Accounting, Finance and Legal), Operations and Supply Chain, Sales & Marketing, Customer Care and Product Development. The Strategic planning report should be a kind of communication tool to help the Insight company on managerial decision-making process with various stakeholders such as accountants, finance professionals, marketers, salespeople, product managers, and supply chain specialists. The reports should be able to provide the analytics of the business operations across the globe to help making better decisions.
Scope of the Research:
The major scope of the research with help of business intelligence is as follows:
• Create data analytics functions dedicated to company’s business intelligence, operational and strategic reporting tools.
• Use dataset provided by the company to build reports for understanding the past performance of the company
• Built Strategic Planning Report including the reports from the business intelligence analysis for the business executives
• Deliver decision relevant findings for each functional units of the business.
• Reports should be able to openly critique and help for the future success of the business
2. Methodology
Insight ais to build a strategic planning report with help of business analytics processes. The dataset provided by the insight company will be used as base for the analysis and to provide decision making capabilities. Analytics tools are used to work on data and make different interpretation of the data to understand the business past performance to make better decisions. The analytics tool will be able to provide information on the key areas and priorities which need more attention in terms of achieving future success for the business.
Initially, data gathered from the business for the analytics will be analysed and understood to find the different indicators that can indicate the performance of the business operations.SAS Visual Analytics tool is used to build the report for strategic planning of Insight. The data from different sources provided by the Insight company to make data-driven decisions will be loaded into the SAS tool to have the reports built.
Time series Analysis: To understand the rend over a time.
1. Trend of the order placed by the customers over the years
2. Number of customers into the business
3. Sales trend of different branch over time
Cluster Analysis: Clusters of observations within the dataset can be studied.
1. Location cluster: Customer purchase based on different location in continent, country wise can be studied to understand the purchasing range across the location specifics.
2. Product line and brand cluster: Product line and brand wise sales and purchase reports.
Linear Regression: To find relationship between two variables
1. Number of products sales against the transaction duration
2. Customers purchasing the products from the company against the time.
Cohort Analysis: Examining the performance of the group over common attributes
1. Brands promoted by the sales representatives
Decision Tree: To understand the regression and classification problems
1. Sales representative ratings and product sold
2. Brand and products under the brand sales
Correlation Analysis: To find the correlation among different indicators of the business sales.
1. Facility efficiency and unit reliability correlation against the product sale, product quality and product material cost.
3. Data Analysis
Insight company’s various internal dataset is leveraged for performing business analytics operations to derive the informed decision-making capabilities.The data provided will be analysed to understand the different parameters and granularity of the information. The analysis can help in getting different insight and understanding to build the data driven decisions. The business objective of understating the past performance should be the key of analysing the data. The data provided by the company must be loaded into the analytics tool – SAS Visual Analytics to build the model from the data to create different reports.
The data provided by the Insight company holds different information and it is across the globe information. It holds data from different units of operations customer, sales, facility, products, order, customer feedback, sales representatives, location of the facilities etc. With the highly extensive dataset provided covering major departments such as customer, order, sales, and facility can help in making better decision, because the business is a toy sale which must be studied form the perspective of saes, products, and customer satisfaction. The different data units should be integrated with each other to build a model of data to make accessibility easier and reliable. The different data units need to be joined and referenced to get the relevant information for the business analytics. To understand the trend of the performance of the company, the transaction date is used.
Measures: The different quantifiable measure from the data must be identified and derive mean, median, standard deviation, range, and percentile on the price of toys, units of sale, products produced, etc. Dimensions/categories: The dimensions of the data are identified such as location – city, country, brand name, sale department, etc, which adds a descriptive value to the data units.
4. Reports And Interpretations
Report 1:
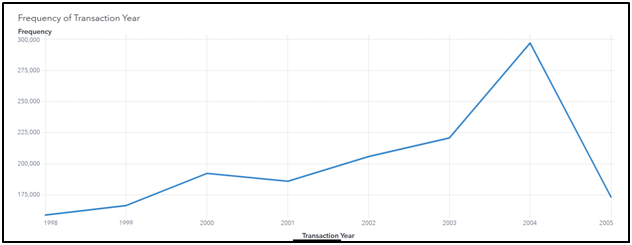
The frequency of transaction every year.
The report is built with frequency and transaction year as a trend report in form of time series line chart.
Interpretation:
The report is built to understand the number of transactions that happen over the years. The trend of transaction can be interpreted from the report. The peak of transaction occurred in the year 2004 and it started to fall in the 2005 to the range of 1999.
Report 2:
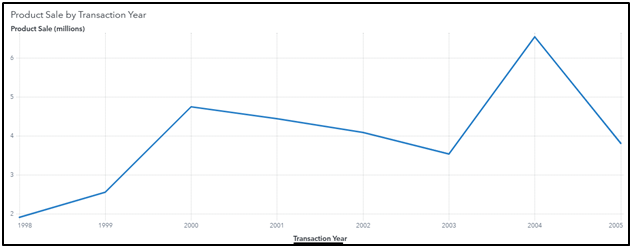
The report is a line chart for product sales in millions in y-axis against the transaction year in x-axis.
Interpretation:
This report shows the trend of the insight toy company product sales over the years. The sale has reached its peak in 2004. It was gradually increasing from 1998 to 2000 and there was downfall from 2000 to 2003. But again in 2005 it is falling. The trend of sales does not seem to be a growing trend, it is not stable.
Report 3:
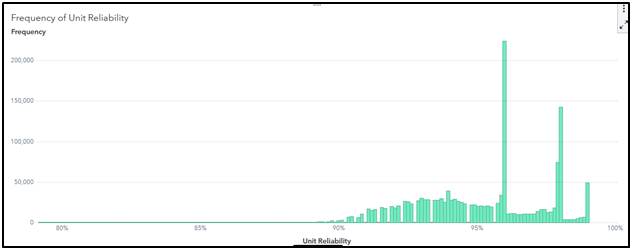
Frequency of the unit reliability in the company
The bar chart is built with frequency based on the unit reliability produced by the Insight Toy company.
Interpretation:
Unit reliability defines how reliable is the manufacturing unit on the products being manufactured. The reliability percentage is plotted against the frequency of the transaction data from the company. It is found that the unit reliability above 90% contributes to the transactions. Unit reliability of above 95% shows very good sale numbers.
Report 4:
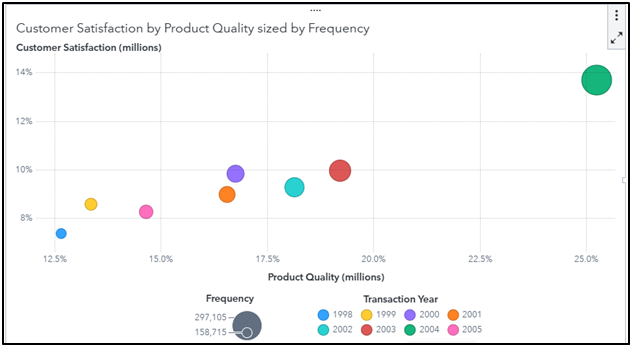
Customer satisfaction against the product quality and the related frequency of transactions.
The bubble plot visual representation is used with customer satisfaction and product quality in terms of the frequency
Interpretation:
The report shows the details of the different levels of customer satisfaction and product quality percentage and its relative frequency. The size of the bubbles shows the number of frequencies based on the customer stratification and product quality. As per the report, in the year 2004, the customer satisifaction and the product quality was higher leading to number number of transactiosn in the business of Insight toy company.
Report 5:
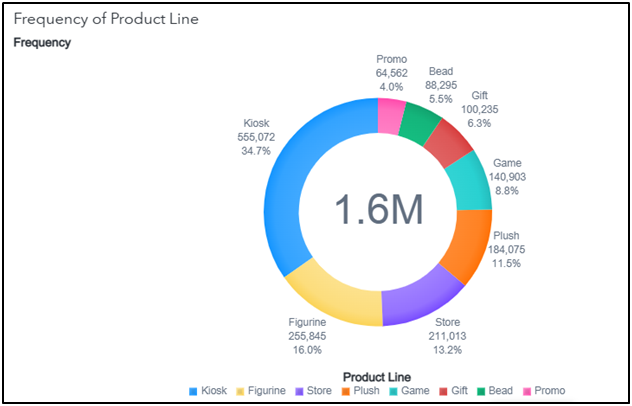
Different product line frequency report of Insight toy.
The report is built with the product line as different category and its contribution towards the overall frequency of the transactions in the insight toy company.
Interpretation:
The report shows the different product line available in the data provided by the insight toy company with the contribution of transactions with respect to each product line category. The business seems to make more sales in Kiosk product line with 34.7% and lowest of the sale in product line promo with just 4%.
Report 6:
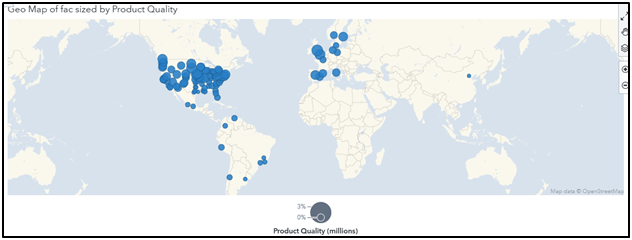
The geo map chart with the facilities for insight toy company with the level of product quality provided by each facility.
Interpretation:
Map is used to locate the facilities available for the insight toy companywith relevance of product quality provided by each facility. As per the below chart we can see that more of the business operations happen in Unites States followed by Europe Region, South America and One facility in China. And the product quality is also good in US and Europe region when compared to other regions. The company has base in United States, with very less presence in Asian countries.
Report 7:
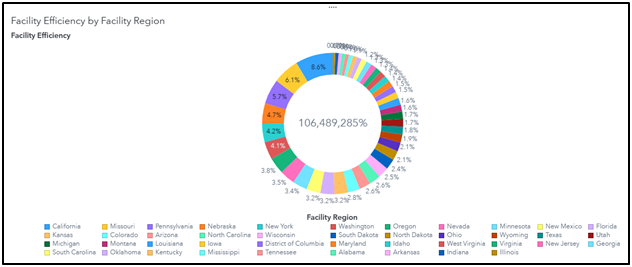
The pie chart for the facility efficiencyin the United States Facility among its different regions. The percentage of sale contribution by each region is shown.
Interpretation:
The business has high concentration in United States. The below pie chart report shows that the California Facility in the United States have higher efficiency in terms of its production of toys. The efficiency of the facilities in United States are higher when compared to rest of the world.
Report 8:
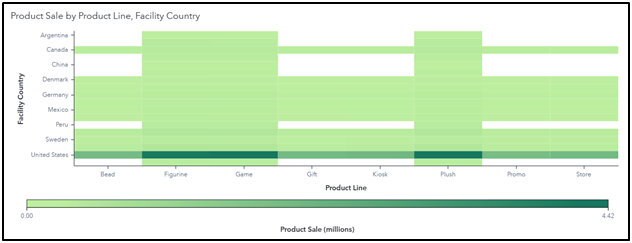
Heat Map for product sale by product line and facility country.
The report is built with product sales as measure and the product line and facility country as a category to measure the product sales. The level of heat or impact is shown by colour variation, with darker colour showing higher level of heat(impact) for the data.
Interpretation:
From the below heat map, it can be interpreted which country and for which product line, the sales are higher for the Insight Toy company. It can be seen from the report that in United States there are more sales of product and specifically the Figurine, Game and Plush product line contributes to more sale in the insight toy company. It can even be interpreted that Plush, Figurine and Game are sold on all countries and rest of the product lines are not available in Peru, China, and Argentina. This shows the company is not completely open to all the product lines in all the countries.
Report 9:
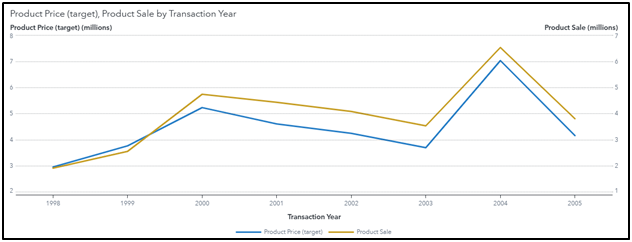
The product price and product sale against the transaction year. Transaction year is used in x-axis and y-axis is the amount in millions to depict the product price and product sale in line chart time series.
Interpretation:
The product sale and product price has seen to have correlation with each other, the trend seems to be similar. It is interpreted that the product price helps to keep the product sales also on the trend. The sale increase can also be due to the product price increase.
Report 10:
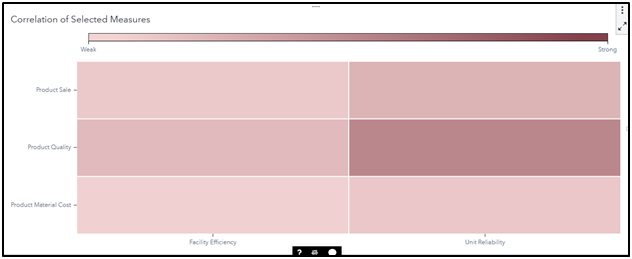
Correlation report with different measure – facility efficiency and unit reliability against the product sale, product quality and product material cost. The correlation efficient is shown in darker colour for stronger corelation levels.
Interpretation:
As per the data provided, the strong correlation is exhibited between the unit reliability and the product quality, The more reliable unit of manufacturing produces better quality products. So, it is understood that the manufacturing unit reliability highly defines the quality of the product. And even the next level of correlation is strong for unit reliability and the product sale and material cost.
Report 11:
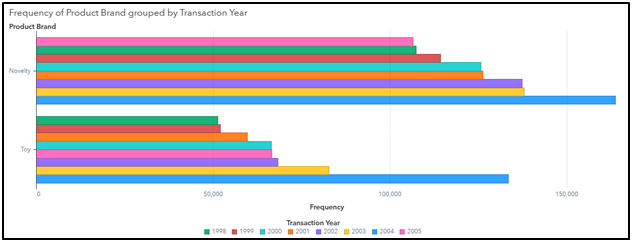
Frequencyof the product brand group by the transaction year.
The report is a comparative bar chart for different categories for the product brand (toy and novelty) against the frequency of sale for each year.
Interpretation:
The below report of comparative bar chart grouped on the transaction year for different product brand shows that the Novelty brand of products have higher frequency when compared to the toy brand of products and it has been the same trend across all years of transactions.
Report 12:
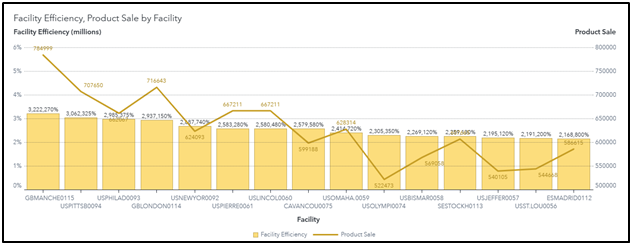
Facility Efficiency, product sale by facility for top facilities data.
The graph is built for all the facilities in the company with its efficiency and product sale data and filter to just top few facilities having high efficiency and product sale data.
Interpretation:
From the report, we can see even with the facility – USOLYMPI0024 with higher efficiency to have lower product sales. It can be interpreted that efficiency cannot be considered as a factor to estimate the sales of the facility particularly.
Report 13:
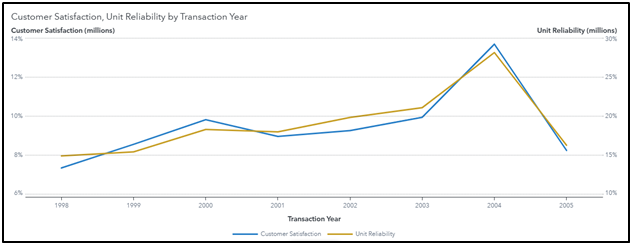
Customer Satisfaction and Unit reliability by transaction Year.
x-axis represents the transaction year and y-axis shows the customer satisfaction and unit reliability.
Interpretation:
This report provides the trend of the customer satisfaction and unit reliability over the years. The trend shows that the customer satisfaction also depends on the unit reliability. The customer had higher satisfaction when there was a higher reliability in the units manufactured. It was higher in 2004 and the other trend reports show that sales also were high in 2004.
Report 14:
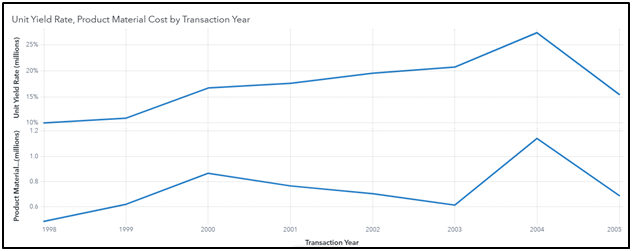
Comparative time series report to show the Unit yield rate and product material cost over the transaction years.
Interpretation:
The unit yield rate of the company and the product material cost seems to be in the same trend across the transaction years. This can show that the unit yield rate from the company can even set the product material cost. Because if the unit yield is less, then it can be due to the cost issues needed for material manufacturing. The cost will impact the unit yields in the industry.
Report 15:
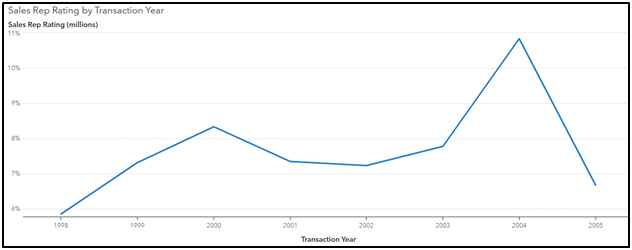
Report on the sales representative rating against the transaction year with help of line chart.
Interpretation:
The line chart trend shows that the sales representative rating over the years are increasing. And when compares with the initial trend reports on the sales it can be highly related to the sales of the products as well. There has been fall from 2000 t0 2003 in the sales representative rating as like the product sales trend.
5. Findings
The reports are built on different perspective of the dataset, to make wider data interpretations. The trends of the business reports are generated on different perspective leading to business sales such as location, facility, product quality, efficiency, and customer satisfaction. Important findings are available on the reports based on the interpretation made from the reports. The findings are highly valid and reliable as it is built from the data from different functional perspective. Based on the different reports generated for the dataset provided by the company with help of business intelligence tools, below findings are made and presented in the Strategic Planning Report.
• The frequency of the transaction over the years trend shows that the starting in 1999 the business presence was less and reached its peak in the year 2004. The trend of business frequency has been a gradual increase from 1999 until 2004. And in 2005, the frequency trend is down. Using 2004 data can help in understanding the boost for business growth and plan accordingly for future. Overall, the business was increasing its presence.
• The product sales were not a gradual increase for the Insight, from 1998 to 2000 the sale raise, but from 2000 to 2003, the product sales started to drop. Interestingly the sale of products increased from 2003 to 2004. The product sale in 2004 was double the level of 2003.
• Higher the reliability of the unit manufactured, higher is the frequency of the transaction. This shows the reliability of the units are highly sort after in the business sales.
• Comparing the product quality and customer satisfaction against the frequency shows that the frequency of business transaction is higher when the product quality and customer satisfaction is at higher levels. The product quality leads to higher customer satisfaction leading to more frequency of transactions. Product quality can enhance the business transactions.
• The Kiosk product line has more presence in Insight business of 34.7% and lowest was Promo of 4%. About quarter level of business happens on kiosk product line, this shows that the business must involve in minimal equal level of business across different product lines line promo, Bead and Gift to further boost business and check why these product lines are lagging.
• The geo map shows that business has presence mostly in United States followed by Europe and South America. Only on facility in Asia available. The global presence of the business is not highly represented by the business. The company must work on building facilities for business in Asian Countries.
• The business presence is highly concentrated in United States for product line Figurine, Game and Plush. Only Figurine, Game and Plush product line has presence in the countries Insight toy operates. Argentine, China, Peru has no sale of Bead, Gift, Kiosk, promo, and store. It can be the reason for low sales in those countries, providing variety to customers can help in boosting business.
• The product price and product sale are relatively same, so it can be found that product price increase does not decrease the sales of the business. The customers make same level of purchase even in case of product price increase. Product price changes does not impact the sales.
• The unit reliability of the manufacturing company and the product quality shows highest correlation. So, the reliable unit productions are of high quality. The facility efficiency also leads to producing good quality products.
• The product brand novelty has higher sales across all years when compared to the toy product brand. Boosting the toy product brand can help in achieving equal sales and manage when any issues occur on Novelty brand. The key should be to analyse the toy brand to increase the sales.
• The facility efficiency and product sales over the years shows that facility efficiency does not depict the product sales. There are even cases when facility efficiency is low the sales of the product was better. Product efficiency does not support the sale of the products.
• Customer satisfaction and unit reliability goes hand in hand. The reliability of the unit highly impacts the customer satisfaction. The Reliability variable impacts the independent variable of customer satisfaction. The company must aim to provide high unit reliability to have better customer satisfaction which can increase the sales in the business.
• The unit yield and product material cost over the year also seems to be impacting each other. The yield for the unit is based on the material cost of the product produced. This shows the business uses the cost to produce the goods effectively with no major loss of material cost.
6. Recommendations
The business analytics provides a better decision-making capability for the business to take decisions to drive the business towards the future success. Using of the business intelligence tools adds to the advantage of the business to have trend analysis with its available data and work on the forecast for business operations. The reports can be trusted to provide the clear view of the business operations as per the findings provided above which the business can consider different parameters when making decisions. Business intelligence analytics can help in making a relative study across differentparameter and dependent and independent variables of the business.
With analysing the reports and the finding, we can understand that the Insight Toy Company has its presence highly in United States and less presence in Asian Countries and are highly recommended to work on expanding operations in Asian countries to make global presence. The product quality and facility efficiencyhelp to attend customer satisfaction leading to increase in sale. The business should never compromise on the quality and the efficiency parameters of the products being produced. The 8 product lines are not being exposed to every country of doing business. The products lines should be made available in all countries to make the business to have presence on different business product lines. The cost of material and the unit yield are relative showing effective use of the money on the production of the toys. The trend can be extended with same set of parameters to see how the business can perform in future and the business can make decisions on what parameters need more focus of development.
7. Conclusion
Insight Toy Company data has been used to build reports to provide the past performance of the company based on which informed decisions can be made by the business in future scope of operations. The reports are built by analysing the key parameters from the data with help of SAS visual analytics tool. The strategic planning reports is built with all the business intelligence methodologies such as trend analysis, cluster analysis, etc and the findings from the report to analysed and presented to the business units of the Insight company. As per the business intelligence report it can be clear that the sale of the toys is impacted by parameters like product quality, facility efficiency, unit reliability, customersatisfaction and sales representativequality. The business must take these key workarounds in the business operations to keep them aligned towards the success of the business. The global presence of all product line of the company also needs to be expanded in future as the presence are mostly in United States only. With help of the business intelligence above findings and suggestions for decision making are provided for the business executives in Insight Toy Company.
References:
• Calzon, B., 2021. BI Reporting – Build Powerful Business Intelligence Reports. [online] BI Blog | Data Visualization & Analytics Blog | datapine. Available at:
• Torres, R., Sidorova, A. and Jones, M.C., 2018. Enabling firm performance through business intelligence and analytics: A dynamic capabilities perspective. Business analytics assignmentInformation & Management, 55(7), pp.822-839.
• Sharda, R., Delen, D., Turban, E., Aronson, J. and Liang, T., 2014. Business intelligence and analytics. System for Decesion Support.
• Stevens, E., 2021. The 7 Most Useful Data Analysis Techniques [2021 Guide]. [online] CareerFoundry. Available at:
• Ukhalkar, P.K., Phursule, D.R.N., Gadekar, D.D.P. and Sable, D.N.P., 2020. Business Intelligence and Analytics: Challenges and Opportunities. International Journal of Advanced Science and Technology, 29, pp.2669-2676.


