Accounting Assignment: Financial Pressure Felt By Businesses During COVID-19
Question
Task:
Accounting Assignment Task:
During the COVID-19 pandemic, numerous businesses have felt enormous financial pressure, especially those in tourism and logistics. As part of the domestic travel industry’s strategy for sustainable future students are required to analyze the historical Balance Sheet and Income Statement, and describe the trends.
Students should also clearly identify and problems and provide meaningful commentary of their impact.
CASE 1- AVIS RENT-A-CAR
a. Conduct a horizontal analysis of the balance sheet and income statement items, analyze the trends, and identify problems.
b. Conduct a common size analysis of the balance sheet and income statement items, comment on the results.
c. Combine the results of the horizontal and common size analyses and make a comprehensive commentary of the firm’s financial health.
Use liquidity ratios, financial leverage ratios, efficiency ratios, profitability ratios, market value ratios, to assess the health of the company.
CASE 2- HERTZ CAR RENTALS
The owner of Hertz Car Rentals decides to prepare a statement of cash flows for their business based on pre-Covid data.
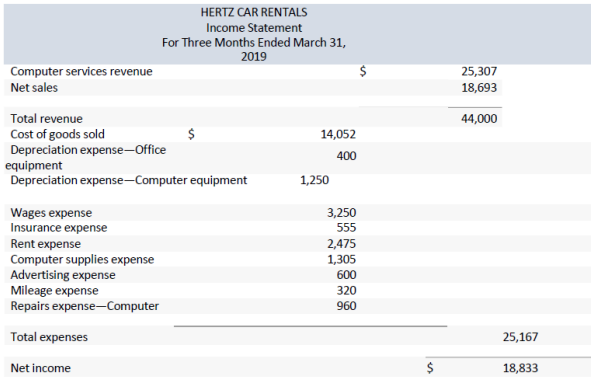
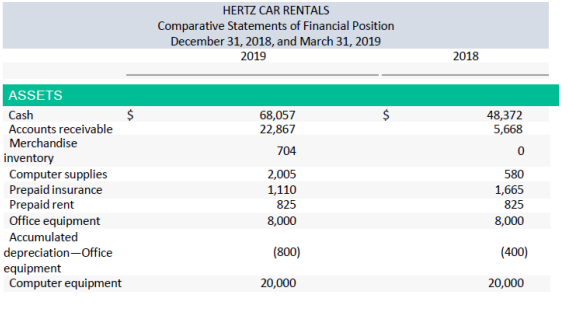
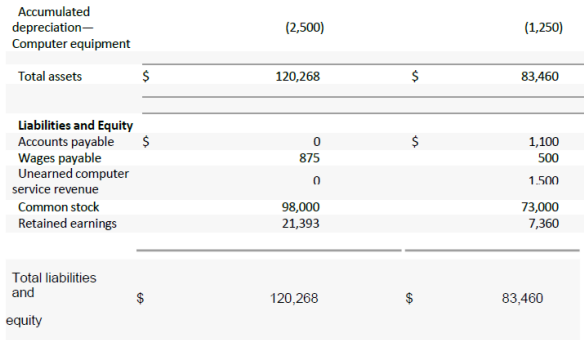
a. Prepare a statement of cash flows from the financial data of Hertz Car Rentals provided above using the indirect method for the three months ended March 31, 2019. Recall that the owner John Hertz contributed $25,000 to the business in exchange for additional shares in the first quarter of 2019 and has received $4,800 in cash dividends. The company’s profit is tax-exempt due to a concession from the government to encourage its type of business. Classify cash paid for dividends as financing activities.
b. Describe your observations from the cash flows.
Answer
ACCOUNTING ASSIGNMENT CASE 1
Part 1: Horizontal Analysis
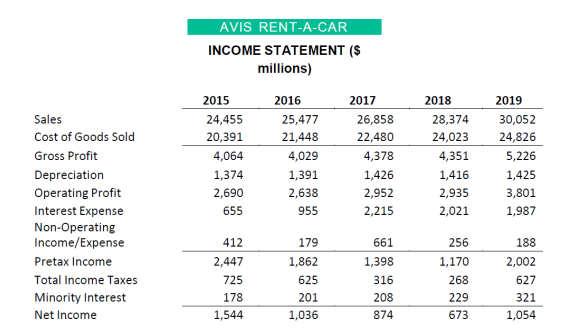
To conduct the horizontal analysis of the income statement items of Avis Rent-A-Car, financials for 5 years starting from 2015 have been considered. The growth rate on year-on-year basis for all the elements of financial statements is calculated under this analysis by taking into account the changes in the financial figures in the 2 consecutive years (Srinivasan, 2018).
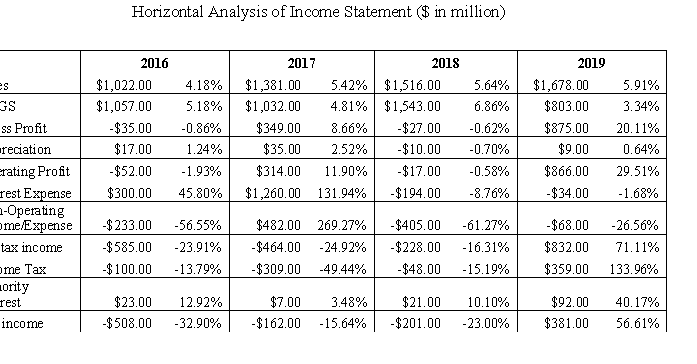
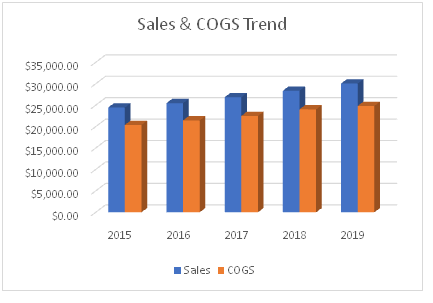
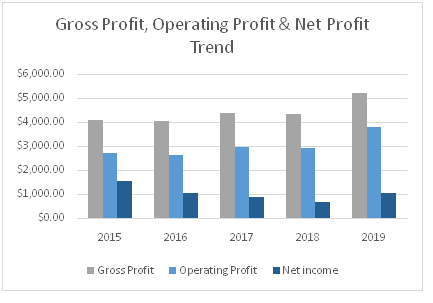
The sales of Avis grew in the past 5 years till 2019 consistently and highest growth in the sales was made in the year of 2019. However, it has been identified that even with the growth in the sales the cost of goods sold did not grow in the same proportion as that of sales. In fact, in 2019, the growth in the cost of goods sold was minimum showing company’s efficiency to generate more profit from its sales. In 2016 and 2018, the growth in the cost of goods sold even surpassed the growth in sales leading to reduced gross profit as compared to 2015 and 2017 respectively. With highest growth in gross profit in 2019on account of increase sales, Avis could generate additional operating income of $866 million than that of 2018 with the maximum growth rate of around 30%. Also, there has been decrease in the interest expense in 2019 amounting $34 million and $194million from 2018 and 2017. It could be observed that even with the highest sales, 2019 could not generate net income as higher than 2015 as the interest expense in 2019 has been quite higher than that of 2015. The minority interest 2019 increased by $92 million and it grew by 40% as compared to last year. Although it is correct to say that year 2019 is not the year with highest net profits but the growth in the net income across the last 5 years has been the highest in this year as company could earn a growth of around 57% in its after-tax profitability and 71% growth in its pre-tax profits. With the growth in pre-tax profits, the company had to additional taxes amounting $359millionin 2019 as compared to 2018, 2017 and 2016.
|
ASSETS |
2016 |
2017 |
2018 |
2019 |
||||
|
Cash & Equivalents |
$298.00 |
88.69% |
-$241.00 |
-38.01% |
$72.00 |
18.32% |
-$153.00 |
-32.90% |
|
Net Receivables |
$373.00 |
11.19% |
$190.00 |
5.13% |
-$115.00 |
-2.95% |
-$88.00
|
-2.33% |
|
Inventories |
$53.00 |
8.60% |
$41.00 |
6.13% |
$27.00 |
3.80% |
$65.00
|
8.82% |
|
Other Current Assets |
$139.00 |
14.93% |
$137.00 |
12.80% |
$112.00 |
9.28% |
$452.00
|
34.27% |
|
Total Current Assets |
$863.00 |
16.55% |
$127.00 |
2.09% |
$96.00 |
1.55% |
$276.00
|
4.38% |
|
Gross Plant, Property & Equipment |
$1,089.00 |
5.23% |
$672.00 |
3.07% |
$1,135.00 |
5.03% |
$955.00
|
4.03% |
|
Accumulated Depreciation |
$799.00 |
8.46% |
$899.00 |
8.78% |
$1,048.00 |
9.41% |
$1,057.00
|
8.67% |
|
Net Plant, Property & Equipment |
$290.00 |
2.55% |
-$227.00 |
-1.95% |
$87.00 |
0.76% |
-$102.00
|
-0.88% |
|
Investments at Equity |
$52.00 |
8.29% |
$9.00 |
1.33% |
$154.00 |
22.38% |
$11.00
|
1.31% |
|
Other Investments |
-$248.00 |
-11.62% |
-$217.00 |
-11.51% |
-$247.00 |
-14.80% |
-$256.00
|
-18.00% |
|
Intangible s |
-$25.00 |
-0.95% |
$28.00 |
1.08% |
-$49.00 |
-1.86% |
-$3.00
|
-0.12% |
|
Deferred Charges |
$529.00 |
622.35% |
-$75.00 |
-12.21% |
-$81.00 |
-15.03% |
-$40.00
|
-8.73% |
|
Other Assets |
-$11.00 |
-6.92% |
$705.00 |
476.35% |
$295.00 |
34.58% |
-$35.00
|
-3.05% |
|
TOTAL ASSETS |
$1,450.00 |
6.52% |
$350.00 |
1.48% |
$255.00 |
1.06% |
-$149.00
|
-0.61% |
|
LIABILITIES |
$0.00 |
|
$0.00 |
|
$0.00 |
|
|
|
|
Long Term Debt Due In one year |
-$293.00 |
-50.00% |
$15.00 |
5.12% |
$96.00 |
31.17% |
$442.00
|
109.41% |
|
Accounts Payable |
-$69.00 |
-4.65% |
-$45.00 |
-3.18% |
$0.00 |
0.00% |
$90.00
|
6.57% |
|
Taxes Payable |
$0.00 |
|
$190.00 |
|
$34.00 |
|
-$224.00
|
|
|
Accrued Expenses |
$43.00 |
2.36% |
$113.00 |
6.05% |
-$69.00 |
-3.48% |
$95.00
|
4.97% |
|
Total Current Liabilities |
-$319.00 |
-8.19% |
$273.00 |
7.63% |
$61.00 |
1.58% |
$403.00
|
10.31% |
|
Long Term Debt |
$18,226.00 |
184.31% |
-$1,115.00 |
-3.97% |
-$415.00 |
-1.54% |
-$1,761.00
|
-6.62% |
|
Deferred Taxes |
-$440.00 |
-53.01% |
-$390.00 |
-100.00% |
$0.00 |
0.00% |
$0.00
|
0.00% |
|
Minority Interest |
$79.00 |
9.54% |
$31.00 |
3.42% |
$57.00 |
6.08% |
$13.00
|
1.31% |
|
Other Liabilities |
$16.00 |
0.83% |
$676.00 |
34.92% |
$278.00 |
10.64% |
-$65.00
|
-2.25% |
|
TOTAL LIABILITIES |
$17,562.00 |
101.15% |
-$525.00 |
-1.50% |
-$19.00 |
-0.06% |
-$1,410.00
|
-4.10% |
|
Preferred Stock |
$125.00 |
|
$39.00 |
31.20% |
-$9.00 |
-5.49% |
-$8.00
|
-5.16% |
|
Common Stock |
-$3.00 |
-75.00% |
$0.00 |
0.00% |
$0.00 |
0.00% |
$0.00
|
0.00% |
|
Capital Surplus |
$0.00 |
|
$112.00 |
|
$53.00 |
47.32% |
$61.00
|
36.97% |
|
Retained Earnings |
-$16,234.00 |
-334.10% |
$724.00 |
-6.36% |
$230.00 |
-2.16% |
$1,208.00
|
-11.59% |
|
TOTAL EQUITY |
-$16,112.00 |
-331.32% |
$875.00 |
-7.78% |
$274.00 |
-2.64% |
$1,261.00
|
-12.49% |
|
TOTAL LIABILITIES& EQUITY |
$1,450.00 |
6.52% |
$350.00 |
1.48% |
$255.00 |
1.06% |
-$149.00
|
-0.61% |
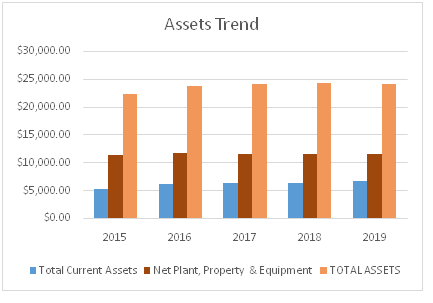
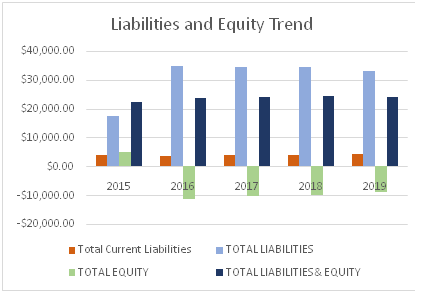
The horizontal analysis of balance sheet of Avis showed that there has been continuous growth in the total current assets from the last 5 years with highest growth in current asset in 2016. The property plant and equipment have shown a fluctuating trend in the last 5 years with a slight reduction in 2019 and 2017 as compared to 2018 and 2016 respectively because of higher accumulated depreciation. The balance of total asset was reduced by $149 million in 2019 from 2018 but the company could still earn an additional profit of $381 million in 2019 which indicates that company has successfully managed to grow its sales even with the reduced deployment of overall assets in the business. The current liabilities of Avis reported highest growth in 2019 as compared to the last 4 years as it grew by $403 million. Also, the total liabilities of the business of Avis increased by 101% in 2016( by $17,362 million) as compared to 2015 and thereafter the total liabilities started falling down with the highest decline of 4% in 2019. As there was no issuance of stock in the last 4 years since 2016 the common stock remained same across the last 4 years. Retained earnings of the business have also reduced after 2015 till 2018 because of reduced profitability.
Part 2: Common Size Analysis
Common size analysis is also known as vertical analysis wherein the financial statements are separately analyzed using certain bases (Srinivasan, 2018).
Common Size Analysis of Income Statement
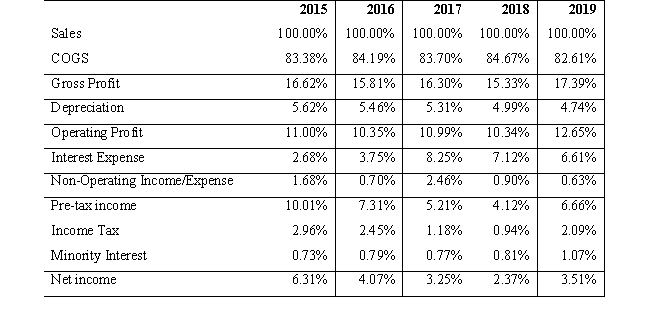
For income statement total sales revenue is considered as the base and the percentages for all the other components with respect to sales are calculated. In the last 5 years under analysis i.e. from 2015 till 2019, COGS percent was reported as highest in 2018 which was around 85% of the sales and was reported in lowest in 2019 as it is around 83%. Hence, the percentage of gross profit is highest in 2019. In fact, the depreciation % was also the lowest in 2019.The interest expense percentage in 2015 was lowest as compared to other 4 years and also the company could generate certain non-operating income. This led to generating of highest profit margin in 2019 which is 6.31%the drivers of high profitability in 2015 were the minimum interest cost, comparatively higher non-operating income and lower minority interest. Even with the increased sales in 2019, the profit margin was not highest because of the factors like high interest, lowest non-operating income and highest minority interest.
Common Size Analysis of Balance Sheet
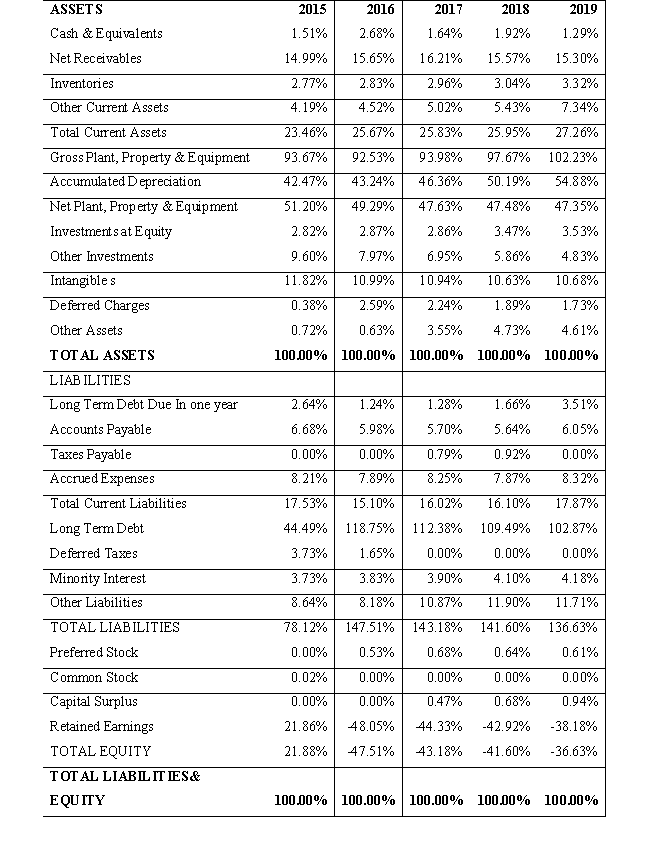
The balance sheet of Avis comprises of different assets and the percentage total current assets in the total assets has been reported as highest in 2019 as there are some other currents purchased during the year. Although, the percentage of gross balance of property, plant and equipment in the total assets was also highest in 2019 in the last 5 years but due to increased accumulated depreciation, the percentage of net balance of property, plant and equipment has lowered down, making it highest in 2015. Liabilities and equity amounts are analyzed using the base amount of total liabilities and equity. The proportion of current liabilities in the total liabilities and equity is highest in 2019. However, the proportion of long-term liabilities is highest in 2016. With other liabilities in place, 2016 has reported highest proportion of total debt in the capital structure of the business. The preferred stock and equity stock both have very small proportions in the total equity and liabilities across all the years as the company is using less on equity financing and heavily relying on debt financing for its business requirements over the period of last five years.
Part 3: Overall assessment of financial health of Avis Rent-a-Car
In order to assess the financial health of Avis Rent-a-Car in the last 5 years starting from 2015, ratio analysis has been performed under which ratios from different aspects of financial performance have been calculated like liquidity ratios, efficiency ratios, solvency ratios and profitability ratios.
1. Liquidity Position

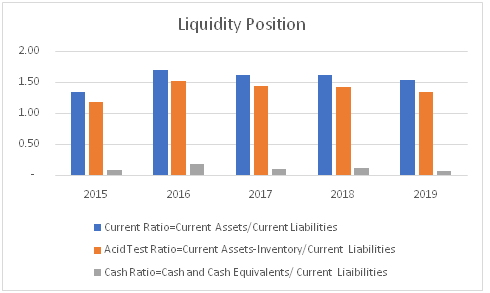
To assess the liquidity position, current ratio is calculated and it has been identified that in 2016, the company had enjoyed the strongest liquidity position out of the 5 years as its current liabilities were reduced to an extent and hence the company had sufficient current assets to pay off its current liabilities. The same could be experienced even in the absence of inventory which a current asset that is not easily convertible into cash. As observed under common size analysis of the balance sheet, it can be said that with the lower proportion of current liabilities in the business; even the quick or the acid test ratio remained highest in 2016. The cash ratio shows the ratio of cash balance with the current liabilities (Mathenge&Muturi, 2017). The cash ratio was also greatest in 2016 majorly because of reduced balance of current liabilities. After 2016, there has been a continuous but slight reduction in the current, quick and cash ratios which indicates that with passage of time and the balance of current liabilities are increasing and balances of current assets in the business resulting to weakening of its liquidity position. The prime reason for such decline in the liquidity position could be Covid-19 outbreak as the Avis belongs to hospitality industry where it provides the services of renting of car. At the inception of Covid-19, businesses in this industry had to face huge expenses to keep their business going on (Škare,Soriano&Porada-Rocho?, 2021). Also, the customers in the market got drastically due to the lockdown event. The economic activities in the physical market got shut for the time being leading to weakened financial position.
2. Solvency Position
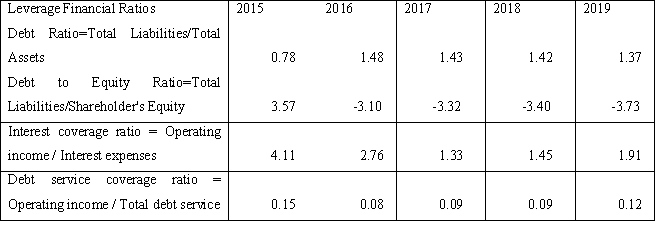
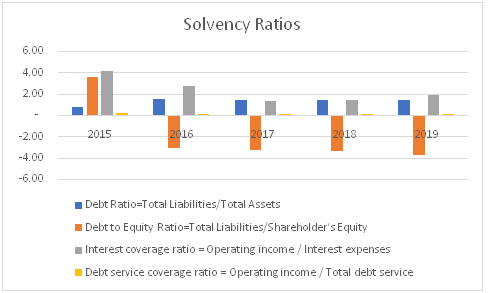
To assess the solvency position of the business of Avis, various financial or leverage ratios have been calculated like debt ratio, debt to equity ratio, interest coverage ratio and debt service coverage ratio. As it could be seen from the common size analysis, Avis is heavily relying on debt financing for its business operations. In 2015, it acquired 78% of its total assets using debt funding, then from 2016 onwards it has grown above 1 which is the clear indicator of financial leverage that the company is facing. Debt to equity ratio in 2015 was quite higher because of excessive usage of debt funding.
However, it went negative afterwards since 2016 because of negative equity balances resulting from negative balances in retained earnings. Interest coverage shows the how many times interest can be paid from the current operating profit. The said ratio was best in 2015 as it could be observed in common size analysis of the income statement that interest cost was only 2.68% of sales because of inclusion of lesser debt in the capital structure. Thereafter, with the increase in total debt of the company till 2017, its interest obligations were also raised which in turn led to increased interest coverage ratio. However, in 2018, the debt obligations started declining slightly which resulted in increasing the interest coverage ratio.
3. Efficiency Position

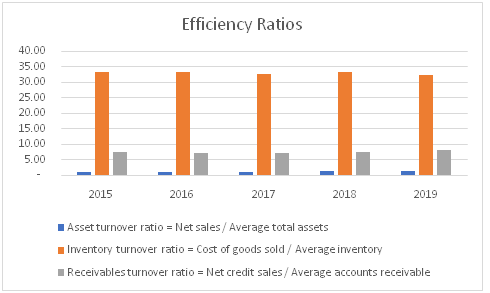
To assess the efficiency of the company in running its business, various turnover ratios have been calculated like asset turnover ratio, inventory turnover ratio and receivables turnover ratio. Asset turnover is showing an inclining trend since 2015. A higher ATR is preferable as it shows that company is able to utilize its shares more efficiently to generate more returns for its shareholders. Although the increase in the said ratio is quite small but since it is continuously growing, it is an indicator of good financial health. Inventory turnover ratio has kept on fluctuating in last 5 years. On the one hand there is an increase in cost of goods sold in response to increased sales and on another hand the inventory is also increasing with different percentages as shown in horizontal analysis. In the last year 2019, the ITR has decreased because of relatively excess increase in inventory than the previous 4 years. As no information of credit sales is given, it is assumed that all the sales are made in cash only. The receivable turnover is favorable when it is higher and it is highest in 2019 as the company has reduced its receivables since 2017. Hence, the efficiency state of Avis can be considered as satisfactory.
4. Profitability Position

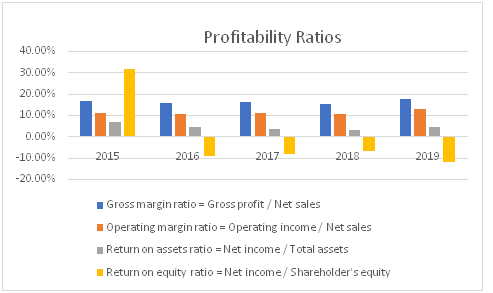
Gross margin ratio has kept on fluctuating because of increasing trend of sales and decreasing cost of goods sold but in an indefinite pattern as reported in horizontal analysis. In 2019, Avis has generated highest GP Margin because of increased sales and the proportionate reduction in cost of goods sold. Operating profit is the gross profit adjusted further for operating expenses like depreciation. It is also reported highest in 2019 because of higher profits remaining after meeting the direct cost of goods sold. However, due to increased interest expense in 2019 and reduced non-operating income and increased minority interest in the profits, the net profits of the year have lowered down from that of 2015 wherein the interest expense was quite minimal as compared to other years on accounts of lesser reliance on debt funding. Even though the profits of 2015 are higher, the net profit margin of 2019 is still higher as with the increased expenses, company could generate more revenue as well. Return on assets shows the amount of profit generated using the assets of the business (Mathenge&Muturi, 2017). The said ratio has declined since after 2015 till 2018 because of reduced profitability and increasing total asset balance account. The return on equity is reported as negative since 2016 because of negative retained earning balances.
The market worth ratios could not be calculated as there is no information available regarding the par value per share and the market value per share. Also, there is no information given regarding the dividend payment made by the company.
From the above report it can be concluded that the profitability position of Avis in 2019 has declined over the past five years since 2015 even with the increased sales because of increase interest expenses and decreased non-operating income. Hence, after 2015 retained earnings remained negative till 2019. The liquidity position can be considered as satisfactory throughout the last 5 years have Avis has sufficient current assets to meet its current liabilities. The company is facing high financial leverage as it is heavily relying on debt sources of finance which involves high interest cost.
CASE 2
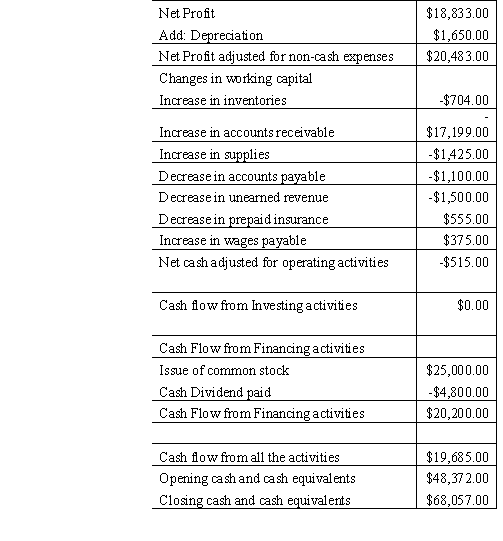
Part 1: Cash Flow Statement
Part 2:
Observations on cash flows:

Cash flow statement of Hertz Car Rentals for the year ending 2019 shows a total of net cash flow of $19685 which comprises of cash flow from operating activities and financing activities. There were no cash flow from the investing activities as there was no additional investment made or fixed asset purchased and also there was no fixed asset disposal or sale of investment. The overall cash flow from operating activities is negative $515 which implies excess outflow of cash than the inflow of cash out of operating activities. The reason of the overall outflow of cash from investing activities is the increase in current assets such as inventories, accounts receivables, supplies and decrease in current liabilities like accounts payable and unearned revenue. The inflow of cash has resulted decrease in prepaid insurance and increase in wages payables. Increase in current assets signifies that company has utilized its cash to purchase or generate more current assets. In 2019, the inventories and computer supplies have been purchased. The increase in the balance of accounts receivables indicates that the company must have given sales on credit which resulted in blocking of its working capital (Amalia, Fadjriah, &Nugraha, 2020. Decrease in prepaid insurance means that the actual due date of payment of insurance had materialized in 2019 and at the time of materialization no payment in respect of this would have been made since the insurance was already paid earlier in the previous years on prepaid basis. This resulted in avoiding further cash outflow in 2019. Therefore, the same has been added. Decrease in current liabilities like accounts payables in 2019 indicates that the company must have made payment of its due creditors in this year. On the other hand, increase in wages payable indicates that there were some payments of wages due in 2019, however, the same has not been paid which had avoided the outflow of cash in that year and avoidance of cash outflow is treated as cash inflow. Apart from the above discussed working capital adjustments, there has been an adjustment made for non-cash item in the overall net income of the year 2019. Depreciation does not result in outflow of cash as there is no payment required to be made in respect of this (Itan&Riana, 2021). Hence, the same has been added in the net income. Net income certainly includes the impact of depreciation as it is an expense on fixed assets for the year but does not result in payment of money in the very year. Further, as the company in the present case is tax exempted there has been no outflow of cash in respect of tax payment.
The balance of fixed assets like office equipment and computer equipment has remained the same in 2019 as that of 2018. This indicates there was no purchase or sale of any fixed asset or investments by the given company.
The financing activities which the company undertook in 2019 include issuing common stock for which the owner Hertz had paid the money as a capital contribution to his own business. This resulted in inflow of cash. However, for the same shares, the owner received a cash dividend for his additional capital contribution in the form of purchase of company’s share. The payment of dividend resulted in outflow of cash for the company in 2019. Even after payment of dividend, company was remained with positive cash balance. As the company started its year 2019 with an opening cash balance of $ 48,372 and there was an overall generation of cash flow during the year amounting $19,685, the resultant closing cash balance was reported as $68,057.
Apart from the general observations on the cash flow movements of Hertz for 2019, some ratios have been calculated as below:
Cash flow coverage ratio takes into accounts the operating cash flows and the overall debt of the company. It shows the capacity of the company to pay off its principal installment along with interest thereon the debt. It can used to comment on company’s solvency position from the point of operating cash flows. Hertz, operating cash flows are determined as negative which indicates that it could not generate sufficient cash flows from its operating activities to pay off its debt obligations. Hence, it can be said that its liquidity position is not good. Further the current liability to coverage ratio shows the company’s ability to pay off its current liabilities as and when due using its operating cash flows. As the operating cash flows are negative in the present case, the company would not be able to pay off its current liabilities. This ratio is indicative of company’s liquidity state from the point of view of operating cash flows. Cash flow margin ratio depicts the company’s profitability position from the point of operating cash flows as it the ratio of operating cash flows to sales of the company. It determines the amount of cash generated with each dollar of sales. As operating cash flows are negative this implies that company could not generate enough of cash from its sales.
Conclusion:
Due to Covid-19, the level of operating activities has certainly declined in 2019 leading to negative cash flow from operating activities. Also, there was no investment activity undertaken by the company in 2019 because as company could have faced various disruptions in the business during the year due to covid outbreak. However, the owner’s contribution to the company’s capital has certainly resulted in positive cash flow from financing activity which is further reduced by payment of dividend in cash.
References
Amalia, S., Fadjriah, N.E. and Nugraha, N.M., 2020.The Influence of the Financial Ratio to the Prevention of Bankruptcy in Cigarette Manufacturing Companies Sub Sector. Solid State Technology, 63(3), pp.4173-4182.
Itan, I. and Riana, W., 2021, September. The impact of cash flow statement on firm value in indonesia. In FORUM EKONOMI (Vol. 23, No. 3, pp. 442-453).
Škare, M., Soriano, D.R. and Porada-Rocho?, M., 2021.Impact of COVID-19 on the travel and tourism industry. Accounting assignmentTechnological Forecasting and Social Change, 163, p.120469.
Mathenge, P.W. and Muturi, W., 2017.Effects of financial management practices on financial performance of public Universities in Kenya. International Journal of Social Sciences and Information Technology, 3(8), pp.2354-2363.
Srinivasan, P., 2018. A Study on Financial Ratio Analysis of Vellore Cooperative Sugar Mills at Ammundi, Vellore. International Journal of Scientific Research in Multidisciplinary Studies, 4(6), pp.1-18.


