A Comparative Analysis Of Descriptive And Inferential Statistics
Introduction
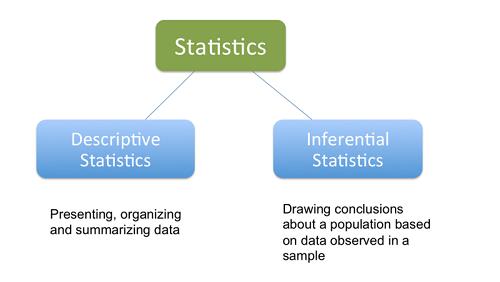
Statistics is a branch of mathematics. The subject focuses on collection, management, examination, interpretation and demonstration of the data. Statistical analysis consists of two types, descriptive and inferential statistics. The two concepts play a vital role during any statistical analysis. Briefly speaking, through descriptive statistics, huge volumes of data can be analyzed by using charts and tables. The entire data is analyzed in this process to draw conclusions rather than just using samples. On the other hand, during inferential statistics, data is taken from available samples to generate a hypothesis or test the already existing hypothesis. A researcher studies the samples in order to reach at a conclusion about a specific population.
The blog on descriptive and inferential statistics would help you to understand both the concept in detail and would include the following points:
- Definition of descriptive statistics
- Definition of inferential statistics
- The distinction between descriptive and inferential statistics
- The need for statistical software in analyzing the data
So, let’s sit down and study the above points in details in this blog on descriptive and inferential statistics without wasting any time.
Definition of descriptive statistics
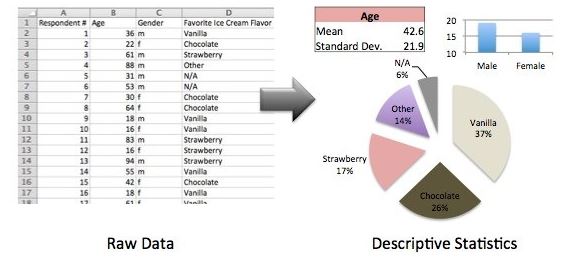
Descriptive statistical analysis makes reports and graphs with the help of data visualization software are for companies to understand a particular event or point that occurred in the past. The name itself signifies that the analysis would be in a description form. It does not lead to a concrete conclusion; rather, it helps in describing the data. Descriptive statistics consist of minute constants which help in outlining and guiding the data set. The data set to be analyzed may be complete or based upon a given sample of the population. Measures of central tendency, along with measures of variability or spread, are the two divisions in the descriptive statistics. The below figure demonstrates the raw data details and the descriptive statistics generated in the form charts and tables.
A measure of central tendency means median and mode. When a raw data is provided with the measure of central tendency, it helps set the position of a frequency distribution. As per the experts of descriptive and inferential statistics, central tendency measures are not specific to a particular condition; it is preferred for types of situations and conditions.
Mean: It is used when there is a continuous flow of data, and the other name of the mean is arithmetic average.
Median: It is used in splitting a given data into two halves. One of the parts is smaller in nature than the other part. It can be used when there is a continuous or ordinal flow of data.
Mode: It consists of a large number of data and is basically used for categorical data.
Now, let’s move on to the discussion of groups that are used in the descriptive statistics.
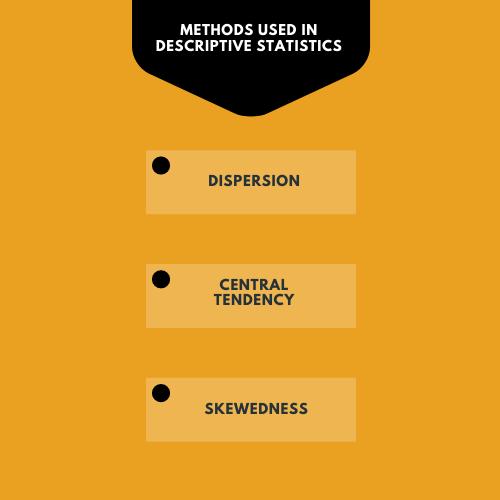
Dispersion: By measuring the dispersion, the data can be extended in the descriptive statistics. An individual can measure the dispersion with the help of deviation and variance.
Central tendency: The mean, mode and median can determine the centre of the data. By using this measure on the data set, a descriptive summary with a single value can be gained.
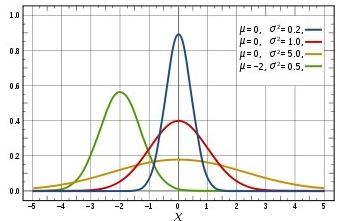
Skewedness: When there is a distortion in the bell curve, or there is uneven distribution, it is referred to as skewedness. As per the experts of descriptive and inferential statistics, by looking at the distribution of the values, it can be said whether it is symmetrical or skewed.
Definition of inferential statistics
Inferential statistics help in drawing conclusions about the larger population basis a sample. It helps in testing different hypothesis related to the given data. To define the term inferential statistics, we first need to understand how the term population is used in statistics. Population in statistics does not necessarily imply that the human population; rather, the term is used for the complete raw data to be analyzed by conducting the descriptive and inferential statistics. Under certain situations, a person may be asked to analyze incomplete data, and in such instances, the person can use the sample data for his analysis work. If in case you want to conduct a study on cancer survivors below the age of 16 years, residing around the globe, you won’t be able to get accurate data. So in such cases, where the total population is not specific or complete, you need to consider a sample data.
When an analysis is to be performed basis a sample population, there are some techniques in inferential statistics applying which inductive reasoning can be generated about the sample population data considered for the analysis. The analyst can reach at a generalized conclusion through the process of inductive reasoning. The analyst can also try to represent a near to accurate result in his analysis by using the sampling process on the given population. Inferential statistics can be majorly used in works related to data science.
But the fact that this sampling process cannot generate an accurate result is true as the sample data used may have some errors or discrepancies which may lead to inaccurate and inconsistent interpretations. It is preferable to use the probability theory while applying inferential statistics.
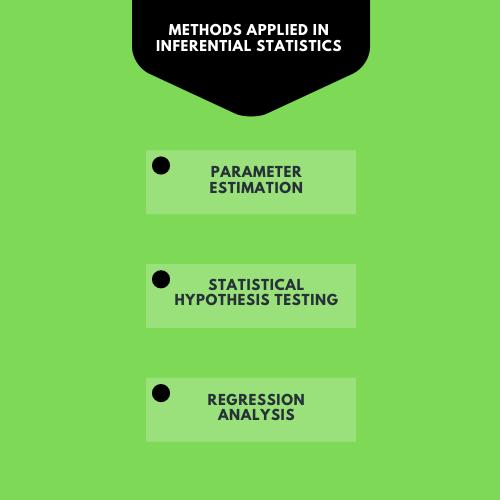
Methods usually applied in inferential statistics are as follows:
Parameter estimation: The entire raw population has some descriptive estimates known as parameters. When the analysis is to be done on a random population sample, then the process is termed as sample statistics. Through this method, the analyst discovers the estimate of a complete population with a sample’s support, but the estimation generated through this process may not be precise.
Statistical hypothesis testing: The aim of this method is to differentiate basis population or verify the connection between variables with the help of samples. With this method’s help, conclusions can be drawn for the entire population basis a sample population provided.
Regression analysis: It explains the connection between a given set of independent and dependent variables. With the help of hypothesis testing, the analysis determines the existence of a relationship as presented in the sample data.
The distinction between descriptive and inferential statistics
Although both descriptive and inferential statistics are used to perform analysis on a given set of data but there lays a huge difference between them in terms process and interpretation of data. The key distinction between descriptive and inferential statistics can be generated on the following points:
When using a descriptive statistics, the analyst has access to the entire raw population data whereas inferential statistics are used by analyst considering some part of the data when the population is too large and cannot be collected or compiled in a single attempt.
Descriptive statistics are used when there is no sampling process requirement, whereas inferential statistics are completely based upon the sampling process and sample parameters.
The descriptive statistics have some properties parameter for the raw population, namely mean, median and mode, whereas in inferential statistics properties parameter for the raw population is termed as statistics.
There are some limitations in descriptive statistics, and it can be applied when the data is actually measured in reality whereas in inferential statistics, sample data from the large population is applied, so there are no such limitations in representing the population data.
It is claimed that descriptive statistics can generate 100 per cent accuracy as it is based upon the complete raw data of the population without any assumptions whereas analysis based on inferential statistics uses sample data and the results can be speculative. There is no guarantee of 100 per cent accuracy in this method as conclusions are drawn based upon some sample population data.
Descriptive statistics help present meaningful data, whereas inferential statistics help compare the data, make hypothesis and predictions.
Descriptive statistics are used in describing a situation, whereas inferential statistics are used to describe the occurrence of any future event.
The descriptive statistics can be explained with the help of graphs, charts and tables, whereas inferential statistics can be explained through probability.
The need for statistical software in analyzing the data
Conducting research requires analysis of huge data sets, and this can be easily done with the application of different statistical software’s tools. Application of such software’s smooth’s the process of descriptive and inferential statistics analysis. It brings accuracy and precision in the results of the analysis and saves time. Using the statistical software during the analysis of descriptive and inferential statistics has great advantages as compared to the analysis conducted manually. The below points will help out in understanding the need for statistical software:
Reduction in error during the sampling process: The success of research depends upon the type of analysis performed on a given set of data. If there are any errors in collecting data or during its processing, then the entire analysis can be considered useless and vague. The sampling process may have some errors when there is a deviation between the actual data and the sample data. The larger database can be accessed with the help of statistical software to generate error-free and customized analysis. It reduces manual intervention, thereby reducing the workload on an individual or a group while performing descriptive and inferential statistics. Majority of the software has an automatic feature that nullifies the requirement of revising the data again and again on its usage.
Accurate result and easy solution: With the help of statistical software, complex questions or problems can be solved easily. In case of analyzing a limited data, it would be the best option to look out for. But in the case of large data, the simplification of the solution could be problematic and may lead to inaccurate analysis. Easy solution and accurate results can be achieved with the application of statistical software’s. There are some features in the software that make handling the analysis an easy way out using multivariate analysis, statistical process control and regression analysis. The three features mentioned are few; there are various other features as well as making the task of handling descriptive and inferential statistics an easy one. The features of the statistical software safeguard the data and the results can be easily understood.
Helping business houses: The statistical software’s can be used by businesses to evaluate different areas to their advantage. The advantages may include judging its employees’ performance, finding a changing behavioural pattern of its consumers, driving audits, and understanding sales performance in different locations. With the help of statistical software’s the business can make future predictions and maximize its profits.
Topmost preferable statistical software’s
If you search for statistical software’s to conduct a descriptive and inferential statistics analysis, you are sure to come across a variety of them. You need to choose the best among all, and it purely depends upon the type of population data and the results that you are willing to see. The software’s are designed with some special programs that allow its users to feed any amount of data and easily come up with a conclusion that was not manually possible. The software’s are basically used by mathematicians, data scientists and industries. Each tool has a unique feature which sets it apart from the rest and depending upon the feature, and you may choose the one that suits you best. Some of the preferable statistical software’s for the analysis of descriptive and inferential statistics have been discussed below:
IBM SPSS Statistics: Industries use the software to solve business-specific issues and reach a correct decision. It has some customized features which can be seen while generating graphs and reports. The software can help generate probabilities, make predictions for future events, plan activities for the benefit of the community, and fulfil objectives and goals.
R Studio: The tool has been created for statistical and data science computing. Individuals and teams can use it at the same time. The resources can be shared in order to generate results to be used by the decisions makers in the organization. With the help of this software assignment related to R, language can be graphically represented. The data can be automatically imported in this software, and it makes navigation within the source file an easy process without inserting any line of code. The plots and the commands generated are efficiently managed through this software.
Stata: It is a tool for the management of all types of data, used in descriptive and inferential statistics analysis, maintaining high-resolution graphics, etc. The software has a simple interface, the help section of the manual explains in details about the commands with support from a wide community. The navigation process is much easier, graphs generated can be used while giving presentations, and the analysis generated is user friendly. To use the software appropriately, one needs to know graphical interpretations and usage of regression and standard errors.
JMP: The tool uses robust statistics and dynamic graphics to present an analysis of the data fed in the memory or in the computer. The software’s interactive and visual feature provides better insights about the data that could not be gained from static graphs or raw number tables. Any amount of statistical problem can be solved with the usage of this software. During the process of descriptive and inferential statistics analysis, the user does not face any problem in handling the software due to its easy interface.
Minitab 18: It is software with different tools that the users can use to analyze data and find solutions to different business problems. Data interpretations are made without any interruptions, and presentations are effortless. One can discover different other advantages by using this software. It has an extraordinary user interface and can be easily located. The tools can be used upon their categorization. When you are stuck at any point in time, you can use the help feature of the software by a right-click, and you will get instant help in the form of step by step guidance.
KNIME analytics platform: It is an overall solution for all data-driven discoveries, helping the users in discovering the prospects of hidden data, generating new insights and making future predictions. It consists of many modules, examples and other tools that can help analyze descriptive and inferential statistics. It checks the workflow, provides mathematical and statistical solutions, generates and predicts algorithms for machine learning. The platform can evaluate a large amount of data involving algorithms and codes with the help of modules. It does not require any programming to perform graphical jobs.
Origin Pro: It is easy to learn and friendly software that helps in data analysis and is able to publish customized quality graphs as per the needs of engineers and scientists. People using this software can engineer operations related to importing, analysis and graphing from the graphical user interface. When there is a change in the data, the graphs, analysis and the reports automatically get updated. The best feature of this software is its customer service which provides quick solutions. The graphics generated through the software is very professional and visually appealing.
NumXL: The software is considered as different from others basis its time series and Excel add-ins. The two features change the Microsoft Excel into an econometrics tool and extraordinary time series software. It provides accuracy in descriptive and inferential statistics along with some shortcuts, which can take you with the entire process. All data can be easily adjusted with the help of add-ins. Customer support is one of its best parts in case you are stuck at any point in time.
SAS or STAT: The software adjusts itself with any type of data being fed in it. It has some techniques that can interpret smaller data sets; some tools can interpret larger data sets by applying statistical modelling tools. The software can also interpret data having incomplete values by the application of modern methods. There are regular updates with different statistical methods and statistical procedures that can be used at any time. It helps in managing the codes and the macros by itself when one does not have enough time to write down the codes in a detailed manner.
SAS base: It is programming language software providing an interface which is purely web-based. Certain programs can be used instantly for data manipulation, data storage and recovery, descriptive and inferential statistics, and reporting. The feature of cross-platform and multi-platform support can be found on this tool. The tool is streamlined, and there are no frills. You can insert your data or write your codes, and the tool will run the data and provide you with the result. You can either do the analysis yourself or pass the result to another program for further interpretations. The tool acts immediately once everything has been put in the right place.
Conducting a statistical analysis with the help Totalassignmenthelp.com
If you are tasked with the analysis of descriptive and inferential statistics, statistic assignment help from total assignment help would be the best option to get help. Experts working on statistics assignment take help from different statistical software to generate quick and accurate results on any amount of data. The interpretations provided by the experts cannot be challenged at any platform. You can contact us for more information’s related to descriptive and inferential statistics. We will help you in solving your statistical problems and other assignment related queries. Along with assignment writing services, a student can avail the below benefits:
Quality work and on-time delivery
Extended revisions
Affordable prices
Non-stop offers on new assignments.
Original content
Quick refund
Immediate service
If you want to verify the quality of our descriptive and inferential statistics assignment or you want check the type of work done by us, please visit our official website where you can search for sample articles related to the field you are having a problem with.
Total Assignment Help
Incase, you are looking for an opportunity to work from home and earn big money. TotalAssignmenthelp Affiliate program is the best choice for you.
Do visit :https://www.totalassignmenthelp.com/affiliate-program for more details
Total Assignment help is an online assignment help service available in 9 countries. Our local operations span across Australia, US, UK, South east Asia and the Middle East. With extensive experience in academic writing, Total assignment help has a strong track record delivering quality writing at a nominal price that meet the unique needs of students in our local markets.
We have specialized network of highly trained writers, who can provide best possible assignment help solution for all your needs. Next time you are looking for assignment help, make sure to give us a try.
Looking for Assignment Help from Top Experts ?
Get the best Assignment Help from leading experts from the field of academics with assured onetime, 100% plagiarism free and top Quality delivery.

