Free Statistics Software Apt For Academic And Professional Purpose

The scope of statistics has increased in many academic disciplines, especially those which are closely related to business studies. Hence the reliance on statistics software is frequent among the academic community. However, it is tough to find the free statistics software which would carry out all the statistical analysis no matter how immense is the presented data. The article would be significant for the students who are pursuing their PhD or research programs in their academic program. We have provided a list of free statistics software that could be completely relied upon for the academic tasks and official purposes.
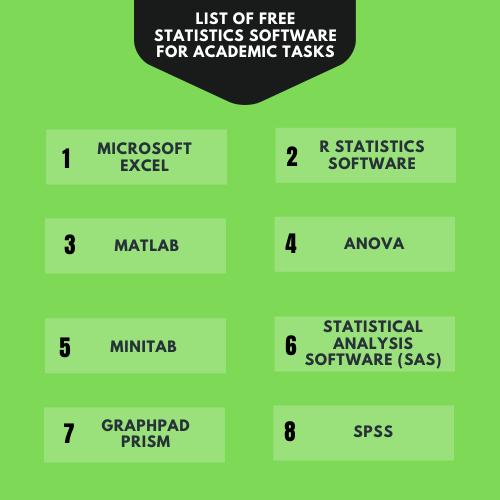
Microsoft Excel
The students who are at the beginner’s level could use the Microsoft excel. The software would provide the user with a wide range of tools to carry out basic analysis of the statistical data. The software could invariably work on various platforms like Android, IOS, and Windows which is published by Microsoft. The presence of the features like pivot tables, graphing tools, visual basics, calculating tabs, etc. makes it a very user-friendly free statistics software. A significant amount of time could be saved by using MS Excel for conducting basic statistical operations. The use of visual data representation in the software would help in presenting the analysis in a much compelling and attractive manner before the audience. The data could be statistically analyzed very easily in the MS Excel software. The software could be exclusively used to draft the custom graphics, related figures, and create summary metrics.
R statistics software
It is to compute the advanced statistics and make relevant graphics that R statistics’ free statistics software is used. Like the research on the human behavioural pattern and similar studies, the complex analysis is conducted using this software. The tool could be used on multiple OS platforms like IOS, Android, and windows. Hence the tool could be labelled as a very flexible one.
You could observe a wide range of graphical and statistical tools in R software. It could easily perform advanced statistical operations like clustering, classification, linear and non-linear modelling, classical tests, time series analysis, etc., along with further associated activities consisting of additional functions and other extensions. Though the software demands technical knowledge, the students who have experience in operating C++, Java, C codes, Python, NET, etc., could easily use the R statistics software.
Like directly introducing the data set to the software, the advanced approach could be used in the R application. Though it is the MS Excel software that is used in the academic context to develop the data set, the R software is more efficient for this task and is even used in the corporate framework. Unlike other software, the subject and variable could be used in the R application. The MS Excel application is very effective in handling and manipulating the huge data set and hence could be used as the subsidiary tool for the R application.
MATLAB
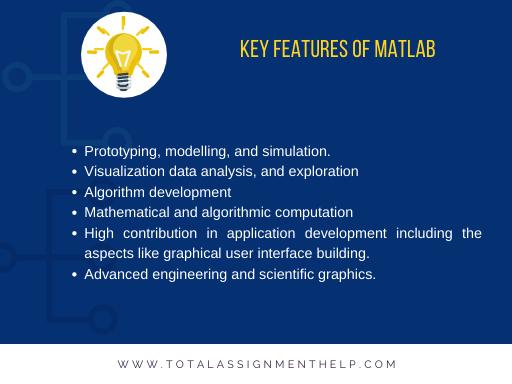
The MathWorks company published the MATLAB application, which provides a multi prototype numerical computing environment for statistical analysis. MATLAB is used when the technical demand for statistical analysis arises since it is a very high performing language software. The software is very efficient in providing the environment for conducting tasks like visualization, computation, programming, etc. It is in the form of authentic mathematic terms and symbols that the solutions and dataset are represented in it. The major implication of MATLAB is listed down in this article on free statistics software.
- Prototyping, modelling, and simulation.
- Visualization data analysis, and exploration
- Algorithm development
- Mathematical and algorithmic computation
- High contribution in application development including the aspects like graphical user interface building.
- Advanced engineering and scientific graphics.
It is the abbreviation of matrix laboratory which is signified by the name MATLAB. Using the platforms of EISPACK and LINPACK projects, the application was developed to access the data set in matrix form. The widespread use of the MATLAB application has initiated changes in it, and a very large transformation has happened in it by referring to the feedback of a large userbase. MATLAB is commonly used for academic projects, and hence it is well-known for university students. The software could contribute heavily to the advanced research level in academic disciplines like Engineering, mathematics, and other branches of science. The ability of MATLAB in delivering premium quality analysis in the researches makes it one of the aptest applications to be used for industrial purposes.
ANOVA
It is the abbreviation of Analysis of Variance, which is signified by the term ANOVA. It is in the classification of analytical software that ANOVA is categorized under. The application has the ability to ensure the presence of collective variability within the data set. It could be classified into two different sections.
- Random factors: The presence of these factors would not create any statistical influence on the presented dataset.
- Systematic factors: The significant statistical influence on the presented data could be observed if the factor is present in the dataset.
It is to determine the effect of such factors that the scholars and researchers conduct the ANOVA test. The test plays a crucial role while studying the dependent variables present within a regression study. The mathematical formula to conduct the ANOVA test is provided in the below section:
F = MST/MSE
The variables are
F = ANOVA coefficient
MSE = Mean sum of square due to error
MST = Mean sum of squares due to error
Minitab
It is by a group of researchers at Pennsylvania State University (Thomas A. Ryan, Brian L, and Barbara F. Ryan) that the Minitab was developed as statistical software. The software was initially named OMNITAB 80. It could be stated as the beta version or the lighter version of the Minitab. By using this tool, the researcher could streamline their focus on result interpretation and data analysis. It is made possible since the software efficiently conducts the creation of high-quality graphs and automated calculations.
The software of Minitab is considered to be more user-friendly as compared to other free statistics software. The method is far simpler as compared to SAS and R. The user could easily manipulate the dataset and create graphs on Minitab. However, the limitation of not performing the machine language in it is one of the major drawbacks. However, its basic mode of operation and the easy implementation of the six sigma application make it one of the most famous free statistics software among the academic community. You will have to make some in-app purchases to access the full features of it, and you could avail a free trial version of it on the internet. The Minitab would turn out to be useful for the students who intend to conduct the task of interpretation of data. It should be understood that the Minitab is not free statistics software.
Statistical Analysis Software (SAS)
It is by the SAS institute that the Statistical Analysis Software was developed. The researchers majorly use the Statistical Analysis Software to check the human behaviour pattern. The tool is used widely all over the world since it is very efficient in carrying out demanding and complicated statistical data analysis. The use of SAS is frequently observed in the task of analyzing social science data. The user has to input the customized commands in the software to carry out various statistical operations. The software would provide the user with an appropriate environment for displaying quality data visualization. It is only on the Windows OS platform that Statistical Analysis Software could be used. The scope of the SAS is significant in both industrial and academic contexts. This is because the application would provide the facility to carry out the advanced operations for statistical analysis. The researcher could apply a high level of customization in the research by using the Statistical Analysis Software.
GraphPad Prism
It is in the field of biology that the tool GraphPad Prism is majorly used. Though, it has also been proven that advanced statistical operations could be done in other fields as well. The approach in it is just as similar in the case of SPSS since the statistical analysis of the dataset is done in an automated manner. The GraphPad Prism could easily conduct the basic statistical operation that is crucial for the clinical research tests and the related laboratories. The operation of this software is limited to the platform of Windows and Macintosh Operating System. It is by using the 2D graphing that the statistical operation is conducted in this application. The tool allows the researchers to vary the choice of change analysis in the later stage.
SPSS
The field of analyzing human behaviour heavily makes use of the SPSS tool. The package had highly contributed to the field of social science. Scholars use it worldwide to carry out the analysis of a very complicated set of information. The major purpose of SPSS is to analyze the multifaceted statistical dataset belonging to social science. It was in the year 1968 that SPSS Inc prepared the prototype of the application. The company of IBM later acquired the application in the year 2009. The command used in this application is very similar to the English words, and hence it is preferable by the users to other free statistics software because of its straightforward nature. The software provides it with a detailed user manual which highly increases its user-friendly characteristics.
The scope of SPSS is very wide in the modern era, and its use could be observed in many fields. The major sectors are marketing organizations, health care researchers, data miners, marketing researchers, academic researchers, companies conducting surveys, etc. The use of SPSS is very frequent in the corporate world. The use of SPSS in the academic field would increase the analytical skills of the student.
Need help with assignments on free statistics software?
Without technical efficiency, it would be very hard for the students to complete a statistics assignment. The tasks often assigned on statistics are very complex in nature. Without proper academic proficiency, it would become very hard for the student to decipher the provided dataset. If you are worried about your academic tasks that require the free statistics software, you could opt for the online assignment help of totalassignmenthelp.com. The expert panel of totalassignmenthelp.com employees around 6000+ experts who are well versed in using the free statistics software. The long history of the company in providing quality assignments all over the world makes it one of the most reliable services for international students. Our company’s solution is 100 per cent genuine, and there is no risk of plagiarism in such instances. In the below section of this article, the frequent themes on which the related assignments are allotted are listed down.
- Hypothesis testing
- Quantitative analysis
- Vital statistics
- Multivariate statistics
- Sampling Theory
- Biostatistics
- Coefficient of theory
- Advanced probability theory
- Binomial distribution
- Descriptive statistics
- Percentile and quartiles
- MegaStat
- SPSS
- Probability distributions
- Linear programming
- Regression analysis
- Reliability theory
- MATLAB
- MINITAB
We have declared a high discount for this academic season. So what are you waiting for? The best academic help service in the world is just a few clicks away. We hope that this article on free statistics software was quite helpful for you. Thank You.


